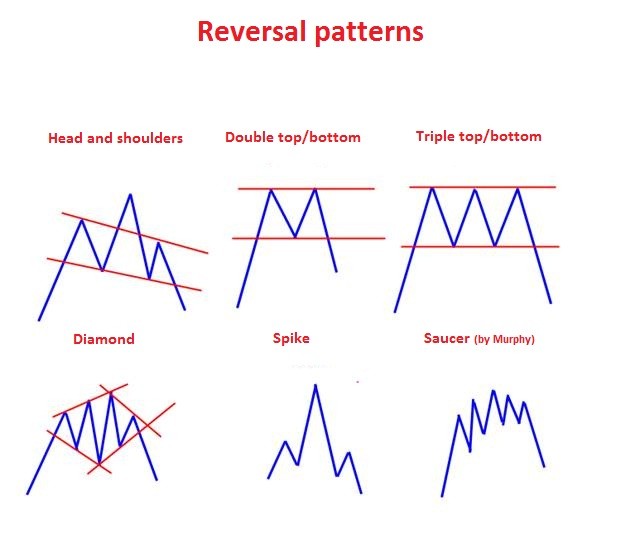
Types of Reversal Patterns
Post on: 27 Июнь, 2016 No Comment

Our trading and investing background is based on how human beings react in herd type behaviors in the stock market. Nearly all trend changes or reversals (Bottoms or Tops) are based on crowd behavioral patterns that we identify.
There are multiple patterns that play out time and time again and these can be seen in the stock market itself every day.
Reversal Patterns come in many shapes and sizes, but what we mean by Reversal is that a stock is about to reverse trend.
This may be over a short, intermediate, or longer period of time.
See the Intra-day WATERFALL pattern below on KORS stock
At StockReversals.com we look for Shorter Term reversal plays, but we also write about intermediate and longer term trend reversals.
3X ETFs can be used for Bullish or Bearish Reversal Patterns which makes them a great tool for traders
Individual Stocks can move quickly and are great for capturing short term spurts and energy for profits
F avorite Reversal Patterns We Identify and Use for Profits:
ABC — These patterns actually can vary quite a bit, but there are a few common ABC traits we look for:
A down, B up, and then C down to finish. We look to buy as C is finishing
This is the opposite of the Downside pattern, its where an obvious C wave is peaking out following the A and B waves, and we look to short the stock near the top of the C wave projection.
ABC- Triangle or Consolidation B wave pattern
Consolidation- This is where there was a preceeding A wave rally, then a B wave consolidation, and we play the end of the B wave to capture what we call a C wave rally to the upside.
Gap Down Pattern
This is where there is an obvious oversold gap to the downside in the stock, and we believe based on both fundamentals and patterns, that buying the gap down at the right point and price will provide a reversal trade profit
Waterfall Decline
This is a proprietary pattern we have labeled with our own name. It looks like it sounds, a stock chart that shows what appears to be a waterfall drop over several days, sometimes weeks. There is a certain 5 wave pattern we look for to alert us to the early potential for a reversal to the upside.
Triangle or Wedge Pattern
These typically take on 5 waves of up and down behavior. Waves 1, 3, and 5 are down, and waves 2 and 4 are up. We look to enter where we think the 5th wave is winding down and a new trend reversal is about to take shape.
These patterns are all outlined loosely below and also with concrete examples on our Sample Reversal Trades Page on the site.
Click Graphics Below To Enlarge In Separate Window


