Trading with the MACD indicator
Post on: 9 Октябрь, 2015 No Comment

Trading with the MACD indicator
The MACD (Moving Average Convergence/Divergence) is a trend-following momentum indicator that shows the relationship between two moving averages of price. The MACD was invented in 1979 by Gerald Appeal. This is probably the most popular indicator whether you trade Stocks, FOREX, or Futures. The MACD is commonly used as a trend or a momentum indicator.
The MACD indicator is the difference between a 26-day and 12-day exponential moving average. A 9-day exponential moving average (a trigger line) is displayed over of the indicator to show buy/sell opportunities.
Calculating the MACD
MACD = EMA(12) [p] EMA(26) [p]
SIGNAL = EMA(9) [MACD]
p = price
The most popular ways to apply the MACD are:
1. Crossover signals
2. Overbought/oversold alerts
3. Divergence
4. Trend determination
MACD Crossovers
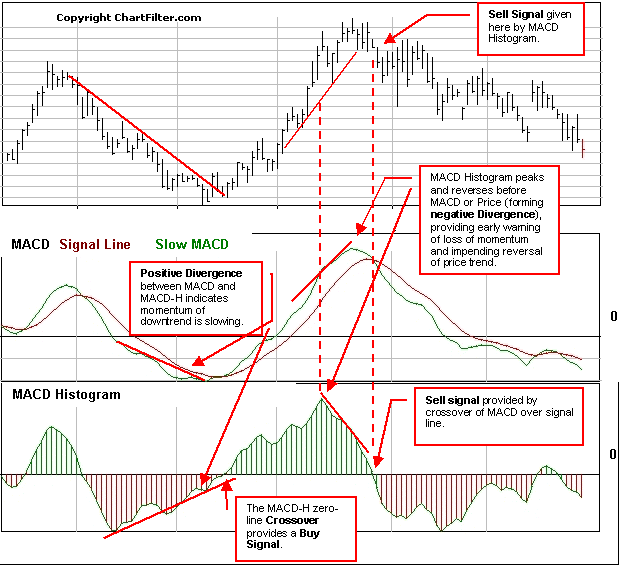
The basic trading rule is to sell when the indicator falls below its signal line. Similarly, a buy signal occurs when it rises above its signal line. It is also popular to buy/sell when it goes above/below zero.
MACD Overbought/Oversold Conditions
The indicator can also be used as an overbought/oversold indicator. When the faster moving average pulls away dramatically from the longer moving average (i.e. it rises), it is likely that the security’s price is overbought and will soon return to normal conditions. Overbought and oversold conditions vary from one forex pair to another.
MACD Divergences

An indication that an end to the current trend may be near occurs when the indicator diverges from the security. A bearish divergence occurs while MACD is charting new lows, and prices do not make new lows. A bullish divergence occurs when the MACD makes new highs and the price action does not make new highs. Beware of using divergences without confirming data they fail more than they succeed. Both of these divergences are more significant when they occur at relatively overbought/oversold levels.
MACD Trend Identification
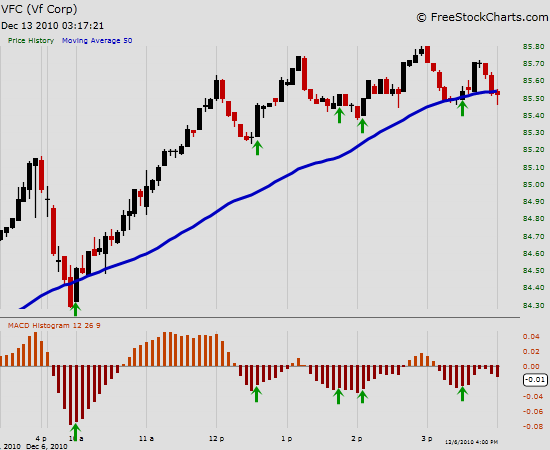
To find the trend, we need to calculate the difference between the MACD line and the signal line. The standard representation is to plot the MACD and signal lines on top of a histogram which represents the difference between the two. Most charting systems will display the histogram at the click of a button.
Since the MACD line is created from the 12-period and 26-period EMA lines and when the MACD histogram crosses zero from below, the shorter-term 12-period EMA simultaneously crosses the 26-period EMA from below. Since the faster 12-period EMA is more influenced by recent prices ( the crossing of the 26-period EMA from below), it indicates recent prices have trended higher; this is seen as a bullish signal.
When the 12-period EMA crosses the 26-period EMA from above, the MACD line will cross zero from above. This indicates that recent prices have trended downward and is seen as a bearish signal.
When the histogram is positive and rising, an up-trend is indicated, so long trades are favored. When the histogram is negative and declining, the chart is in a down-trend indicating that you should trade short.
Contributed by Toyogo00, Lori, Zorlev, Robma & FibMaster at
All content of this website ©TraderZine.com all rights reserved.


