Multiple Tops
Post on: 5 Июнь, 2016 No Comment

What is Multiple Tops chart Pattern?
Multiple Tops is a chart pattern, formed by price action, with several swing tops placed side by side, almost at the same level. It is quiet profitable reversal chart patterns. Although this pattern is rare It has a high probability of success. This is created in an uptrend when the price hits a resistance level several times and reverses to continue in a downtrend.
They are the pressure areas in a stock chart, which may be a major resistance area, or it may even be a major target area. Here most traders having long position book profit. And selling for short trade begins. The trend changes from uptrend to downtrend. The resistance trend line of this pattern is an almost horizontal line connecting the several swing tops of the pattern. Multiple Tops is a chart pattern, formed by price action, with several swing tops placed side by side, almost at the same level. It is quiet profitable reversal chart patterns. Although this pattern is rare It has a high probability of success. This is created in an uptrend when the price hits a resistance level several times and reverses to continue in a downtrend.
They are the pressure areas in a stock chart, which may be a major resistance area, or it may even be a major target area. Here most traders having long position book profit. And selling for short trade begins. The trend changes from uptrend to downtrend. The resistance trend line of this pattern is an almost horizontal line connecting the several swing tops of the pattern.
It is so named because the pattern has multiple swing tops and several swing bottoms. Hence the name Multiple Tops Chart Pattern.
Trend is your friend. Dance with the friend. Tune to the trend.
How Multiple TopsChart Patterns are formed?
There are two great forces which move the price up and down. They are demand and supply. Multiple Tops is the result of increase in supply over demand for the stock.
These are pressure areas in an uptrend. These are major target areas or major resistance areas where most traders wish to unload their long position. Here uptrend changes to downtrend.
The whole formation is similar to Triple Top formation. But the price swing drama is repeated several time to create several swing bottoms and multiple swing tops.
In an uptrend the price keep making higher high swing highs and higher high swing lows. As the target area or the resistance area is approached there is increased selling. As the supply increases the price falls down forming a swing high. This swing high forms the first swing top of multiple tops chart pattern formation.
Because of increase in supply over demand for the stock, the price falls. When price fall considerably, buying continues because it is a bargain price to buy at a lower level in view of previous price rise. So there is an increase in the demand for the stock and the price rises. This price rise creates the first swing bottom of this pattern.
Although many traders are buying and the price is rising, it is not backed by smart money. Major funds are not buying. Instead they are interested in selling at this level. This time the price does not rise much above the previous swing high. It does not make a higher swing high. Rather it just rises to the level of previous swing high which is the major resistance level.
Here the supply again increases and the price swings down forming the second swing top of this multiple top chart pattern. This falling price exhausts at a level and moves up again, making second swing bottom.
This drama of price moving up to the level of resistance and falling down with increased supply and again moving up to the level of resistance, is staged several time.
The rising price hits the resistance for the final time. It fails to penetrate it. Now for the last time price falls to make the last swig top of this multiple tops chart pattern formation.
A trend line connecting the highest points of these swing tops and extended to right forms the resistance line for this pattern.
Between these multiple swing tops there are several swing bottoms. A horizontal trend line drawn at the lowest point of these swing bottoms, forms the support line for this pattern.
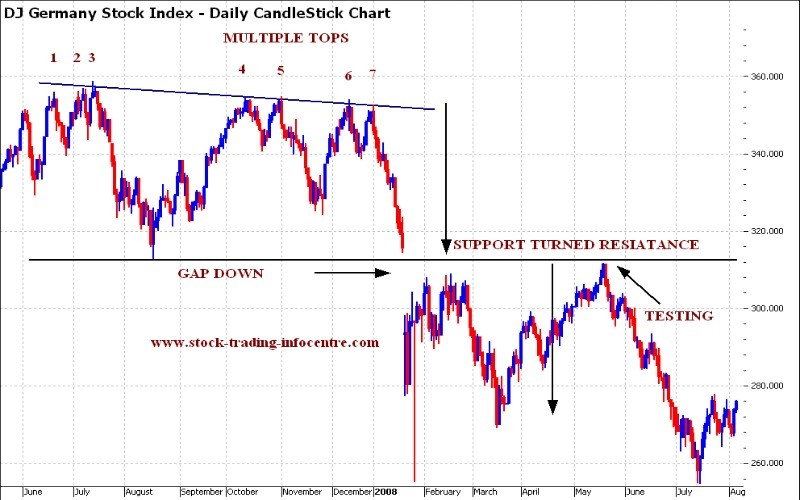
Study the chart given below.
This chart shows a Multiple Tops Chart Pattern which is the bearish reversal pattern in an uptrend. Observe the gap down which is the result of very high bearishness at the breakout point.
What is the significance ofMultiple TopsChart Pattern?
Pattern trading is one of the strategies of making money in stock trading. Among the chart patterns Multiple Tops chart pattern formation gives us the opportunity to cover our long position and enter a short trade. Though they are rare patterns, these trades will have high rate of success.
What is invisibly going on in the market is very well expressed on the visible chart. The first top is higher high swing high with higher high swing low. This is in tune with an uptrend. But unusual increase in volume at this level should rise suspicion of heavy unloading of stock. It is easy to distribute great quantity of stock in a bullish trend.
The failure of second swing top to form higher high swing high at the level of the previous resistance, tells us that the price rise has arrested. If the resistance is strong enough to stop the further rise of the price, it is an indication that bears are active behind the screen.
If the price faces resistance, it should alert the formation of multiple tops. First two tops that is double tops are formed. Later three tops that is triple tops are formed. Like wise it can continue to form several tops, before the price totally fail to go above the swing tops.
Now all the buyers are exhausted, the price falls and breakout below the support trend line of this pattern. Here the price drops below the previous swing lows and a lower low swing low has formed. Now a downtrend begins. By definition downtrend is marked by lower low swing lows and lower low swing highs.
Volume invariably rises as the prices falls after the last swing top. It increases further after the break out of the swing bottom.
How to trade Multiple Top Chart Patterns?
The moment you see a stock making a triple tops chart pattern cover all your long position and get ready to go short below the support line drawn below the low of all the swing lows. A close below the support trend line is a sell signal to go short. Protect this short trade by placing a stop loss buy order above the resistance trend line of this triple top chart pattern.
Once the price breaks down below the support line, many a time it pulls back to test the support turned resistance line. Those stocks which does not pullback after a breakout perform better than those which do pull back. Stocks which breakdown with heavy volume do better than those which breakdown with low volume.
If the price pulls back and falls, move the stop loss buy order to just above the swing high formed when the price falls after pull back.
The minimum target for this short trade is equal to the range of the pattern. That is the height from the support line of the pattern to the resistance line of the pattern, applied below the support line from the break down point. Though this is the minimum target, many times the reward will be many times this which increases the risk to reward ratio.
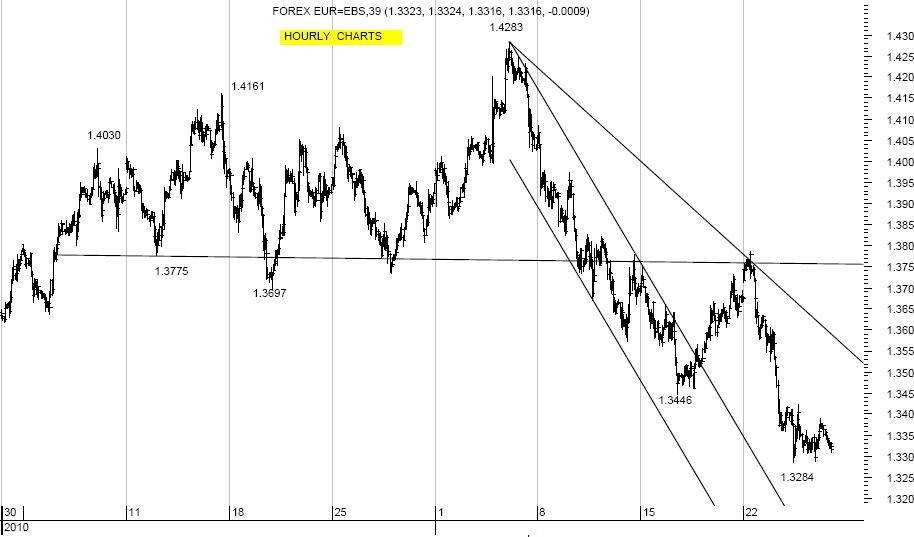
This chart shows a Multiple Tops Chart Pattern which is the bearish reversal pattern in an uptrend. The price has fallen four times its minimum target. This chart is same as above chart continued in time. Here the risk to reward ratio is 1:4.
The multiple swing tops need not be exactly at the same level. A difference of up to three percent, is considered as acceptable.
If the prices breaks above the multiple swing tops, we get a resistance break out trade, which will be a very strong uptrend.
Click here to buy books on Chart Patterns
Related Readings
There are many more chart pattern formation used in pattern trading. Some of them are listed below. You may click on the name of each chart pattern listed below to learn and understand more about them.
Continuation Chart Patterns
- Falling Wedge
Falling Wedge is a continuation chart pattern, formed by price action, which is contained with in a converging and descending trend lines.
Rising Wedge is a continuation chart pattern, formed by price action, which is contained with in a converging and ascending trend lines.
Flag Patterns are continuation chart patterns, formed by a minor consolidation, which is contained with in a small rectangle or a parallelogram.
Falling Wedge is a continuation chart pattern, formed by price action, which is contained with in a converging and descending trend lines.
Reversal Chart Patterns
Head And Shoulder is one of the very common and profitable reversal chart patterns. It is very reliable with 90% probability.
Reverse Head and Shoulder is one of the very profitable bullish reversal chart patterns seen in a downtrend. It is very reliable with 90% success rate.
Double Bottom is a reversal chart patterns, where a stock in a down trend, hits a support level twice and reverses to continue in an up trend.

Double Top is a reversal chart patterns, where a stock in an up trend, hits a resistance level twice and reverses to continue in a down trend.
It is a reversal chart pattern.
Triple Top is a reversal chart patterns, where a stock in an up trend, hits a resistance level thrice and reverses to continue in a down trend.
Trend Line Break is a reversal chart patterns, where a stock in an up trend, breaks out of a support trend line and a stock in a down trend, breaks out of a resistance trend line.
Gaps are continuation chart pattern, formed by an unfilled space between two trading session. Gaps are referred as Tasuki, meaning window in candlestick charting. It can also be a reversal chart patterns.
Island Formation is a reversal chart pattern, formed by price action in a group of multiple time period, which is separated from rest of the price action by gaps. It is very reliable with 80% probability.
Abandoned Baby is a reversal chart pattern, formed by price action in a single time period, which is separated from rest of the price action by gaps. It is very reliable with 80% probability.
It is a reversal chart pattern.
It is a reversal chart pattern.
It is a reversal chart pattern.
Both Continuation and Reversal Chart Patterns
Ascending Triangle is a chart pattern, characterized by horizontal top and rising bottom. This is created when a bullish market pushes the price up against a resistance level. It can be both continuation and reversal chart patterns.
Descending Triangle is a chart pattern, characterized by horizontal bottom and sloping top. This is created when a bearish market pushes price down against a support level. It can be both continuation and reversal chart patterns.
Symmetrical Triangle is a chart pattern, characterized by converging top and bottoms. This is created when there is indecision in the direction of the market. It can be both continuation and reversal chart patterns.
Rectangle Formation can be both continuation and reversal chart patterns. The stock prices tend to move between two horizontal support and resistance lines.
Click here to buy books on Chart Patterns


