Multiple Time Frames
Post on: 2 Июнь, 2016 No Comment

What Does Trading with Multiple Time Frames Mean?
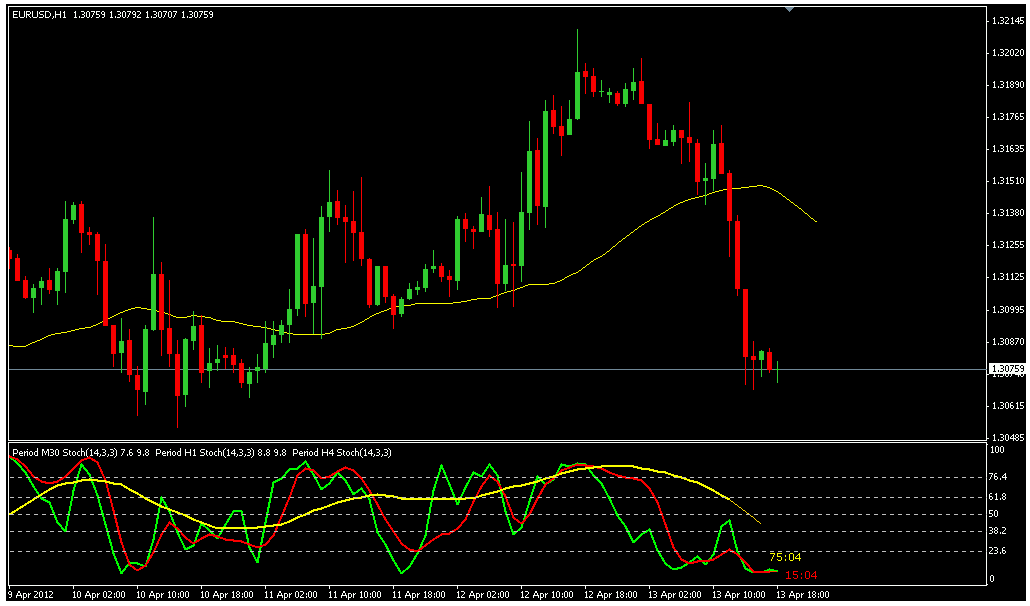
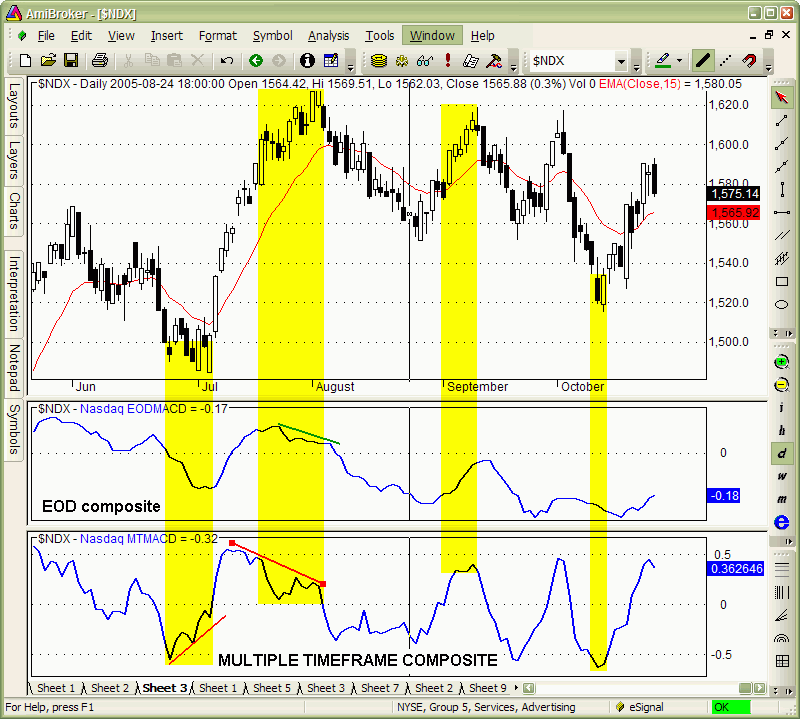
If a trader uses both a 30 minute chart and a 5 minute chart of the same stock within his trading strategy to set-up, trigger a trade, and create a stop-loss order he is using multiple time frames. Or he may be using a daily chart, 60 minute chart and a 10 minute chart for set-ups, entries and stops.
Different time frames can be used for exits as well, however that has never been my style. I’ve always managed my exits from a single time frame due to the short time frame of day trades.
The term fractals is often used when discussing the topic of time frames and trading. It’s a term that was used extensively by Benoit Mandelbrot in his mathematical work. When applied to price charts it means that no matter whether you are looking at weekly, daily, or minute price charts, you will see common chart patterns throughout each and if the time frame on each chart was erased, you wouldn’t be able be to tell which one was which.
Why Use Multiple Time Frames?
Using a multiple time frame strategy to reduce risk on trades is a viable approach to day trading if done properly. But, like someone using too many price indicators on their charts, time frames can be used excessively too. I’ll explain that in a moment.
Lets go over a simple example of how a trader might use two time frames (60 minute & 10 minute) to find a trade set-up, trigger an entry and determine stop-loss order placement. If a trader wanted to take trade entries and set stops off a 10 minute chart, but only in the direction of the trend on a higher time frame, he could do that using a 30 minute or a 60 minute chart.
The first chart below is an hourly chart of the ETF QQQ. For example purposes, lets say a trader considers a down trend to be when a 15 sma of price has a downward slope as in the next chart. That gives him a trade set-up for which he can now look to the shorter time frame for a potential short entry and stop placement.
Now that he’s determined the trend is down on the hourly chart, he’s looking at his 10 minute chart, and decides that a break of the low of the set-up bar will trigger his short position. His short trade is triggered and he uses the price chart structure within the 10 minute chart, not the 60 minute chart, to place his stop loss order.
By doing this he reduces his risk on the trade by keeping the initial stop loss order closer to entry compared to what might be used on a 60 minute chart, but yet still at an appropriate level according to the lower time frame. Taking the trade in the direction of the larger trend in this case led to a very profitable ride down until the end of the day.

The objective here was to create a low risk — high potential reward trade, by keeping the stop tight and letting the longer time frame run price lower through the day.
Some traders like to over do it with multiple time frames in the same manner some do with mutiple price indicators on their charts. Three time frames might be fine.
The most I’ve ever used with my strategies is two. Any more than three fractals, imho, is just overkill, can be confusing, and can take up far too much screen space when trading multiple stocks.
Some feel that getting the entry down to a 1 minute bar is some how necessary. I don’t think so. You might get your risk down to a really tight level using 1 minute bars, but the trade-off is going to be more losing trades and higher commissions in the long run. But, to each his own. I prefer less trades.
In my day trading eBook I go into far greater detail on the topic of trading multiple time frames. I also show methods to locate set-ups the day before a trading session so that a trader has a solid plan to execute the next morning.


