Lockheed Martin An Analysis Using The Capital Asset Pricing Model Lockheed Martin (NYSE LMT)
Post on: 22 Сентябрь, 2015 No Comment

Summary
- I use the Capital Asset Pricing Model to illustrate the risk-return characteristics of Lockheed Martin (LMT) during a period of market upturn and a period of market downturn.
- The analysis shows that Lockheed Martin is among the best performers during periods of market upturn, while being the greatest under performer of the S&P 500 during market downturns.
- However, I believe Lockheed Martin’s impressive characteristics as a dividend stock will continue to be of appeal to long-term investors despite defense spending cuts.
In this article, I use the Capital Asset Pricing Model to illustrate the risk-return characteristics of Lockheed Martin (NYSE:LMT ) during the time periods 8th September 2008 to 7th November 2011, and 7th November 2011 to 13th January 2015. In the analysis, I demonstrate that Lockheed Martin shows a high Jensen’s Alpha return during periods of market upturns, and significantly underperforms the market during periods of market downturns. In this context, I compare the performance of Lockheed Martin with competitors Boeing (NYSE:BA ), General Dynamics Corporation (NYSE:GD ), and Northrop Grumman (NYSE:NOC ). The analysis demonstrates that Lockheed Martin has been among the best performers during the latter period, and the most underperforming during the former.
8th September 2008 — 7th November 2011
As can be seen from the below, all four companies lag the market index during this time period, with Lockheed Martin showing a negative Jensen’s Alpha value of -0.09%. Additionally, we see that with an R-Squared value of 7.28%, only 7.28% of the company’s returns are explained by the market index, the remaining 92.72% is owed to extraneous factors. This would imply that Lockheed Martin would significantly underperform the market index during periods of market downturns assuming a similar R-Squared value during this period. Nevertheless, the three other aerospace and defense stocks included in the analysis also show negative Jensen’s Alpha values, suggesting that the aerospace and defense industry is likely to underperform during periods of market downturn.
Source: Yahoo Finance

7th November 2011 to 13th January 2015
The results below illustrate that with a Jensen’s alpha of 0.04% on a daily basis, Lockheed Martin, along with Northrop Grumman outperform the market daily return of 0.02% during this period. In addition, the R-Squared value indicates that 38.57% of the company’s returns are explained by the market index, the remaining 61.43% is owed to extraneous factors. Additionally, we see that the beta of 0.8 is the lowest for all four companies, and notably the risk-return slope in the aerospace and defense industry during this period is negative, i.e. the higher the beta, the lower the overall return.
Source: Author’s Calculations
Source: Yahoo Finance
Surprisingly, the returns of these companies do not appear to be greatly influenced by defense spending. For instance, we can see in the graph below that for the period 2008-2011, defense spending increased quite significantly, reaching almost 6 per cent of GDP in 2010. However, returns for Lockheed Martin and other companies in this industry decreased quite significantly during this period. However, defense spending has since dropped and is expected to account for 4.6 percent of GDP this year — returns for the four companies have conversely increased during this period.
Source: usgovernmentspending.com
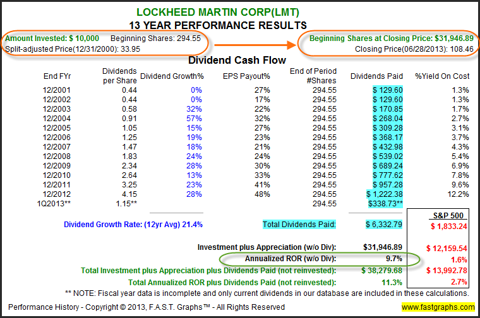
In this regard, despite the fact that the Pentagon is set to seek a 20% cut in war funding, I do not see this having a great impact on Lockheed Martin’s returns during this time. Therefore, I don’t think Jim Cramer is too far off the mark when he states that Lockheed Martin, along with Northrop Grumman is set to go higher. Additionally, given Lockheed Martin’s impressive dividend yield of 3.09% which is the highest of the four firms, along with 12 years of consecutive dividend increases, this holds a lot of appeal to income investors who are not too concerned with short-term performance relative to the market.
In conclusion, I believe that the findings of this article offer several useful insights. Firstly, according to these two time periods the rate of defense spending has not correlated highly with Lockheed Martin’s returns, with the company exhibiting negative returns during periods of greater spending and positive returns during periods of lower spending. In addition, the aerospace and defense sector in general exhibits a negative risk-reward ratio during periods of market upturn, i.e. the lower the risk, the higher the reward. Lockheed Martin has shown the lowest beta value during the most recent period, and despite the fact that it is prone to a high degree of capital loss during periods of market downturn, its impressive characteristics as an income-oriented stock means that long-term investors stand to benefit from increasing dividend payments and a high degree of capital gains during periods of market upturn.
Disclosure: The author has no positions in any stocks mentioned, and no plans to initiate any positions within the next 72 hours. (More. ) The author wrote this article themselves, and it expresses their own opinions. The author is not receiving compensation for it (other than from Seeking Alpha). The author has no business relationship with any company whose stock is mentioned in this article.


