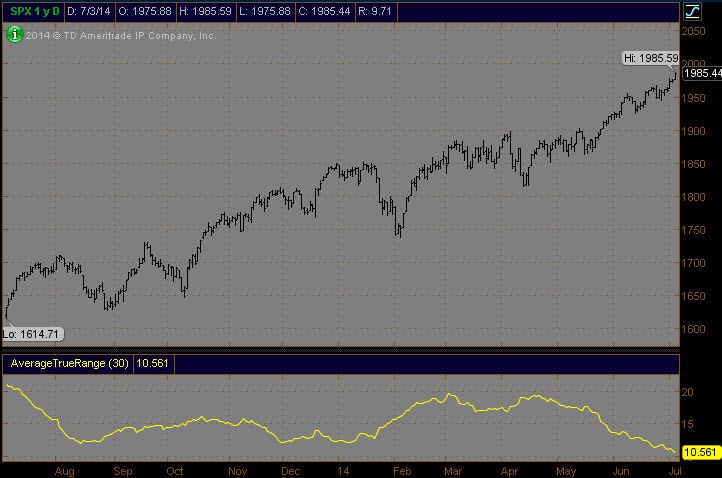
Kevin s Market Blog Average True Range What Is It And How Do I Use it
Post on: 30 Июнь, 2015 No Comment

Thursday, July 12, 2007
Average True Range: What Is It And How Do I Use it?
I received a few emails asking me to explain what the Average True Range is so I decided to write the following post along with a couple of charts.
True Range is the greatest of the following three values:
The distance from today’s high to today’s low.
The distance from yesterday’s close to today’s high.
The distance from yesterday’s close to today’s low.
True range differs from range because true range includes any overnight gap that may take place from one day to another. For example you can have a stock that has a daily range of 50 cents, so the average range over 10 days would be 50 cents.
Now lets say that same stocks gaps up or down over a dollar just about every day. The range for this stock over 10 days will still be .50 but the true range for this stock will be 1.00 because of the gaps.
As a trader I want to know about such gaps because I need to be aware of how volatile a stock really is so that I can place my stops accordingly.
Average true range is simply an average of the true range. In my experience anywhere from 5 to 14 days is usually a good measurement to use when trying to determine a stock’s volatility. I like to use 10 days.
The reason why I use average true range in calculating my stop loss orders is because volatility represents market noise. Average True Range (ATR) is a way of measuring volatility and what I do is take a percentage of that value and subtract it or add it from my entry price depending if I am long or short. By doing so, Im probably going to have set my stop loss order beyond the immediate noise in the market. This is why I use ATR in my trading because it adapts to the current volatility.
So for example. if I am long and I want to place a stop loss order, I would look at the current ATR and use maybe 1.5 times that value subtracted from my entry price. This means the market would have to move more than it’s average daily range including its average daily gap to stop me out.
We just looked at how ATR is used for stop placement, now I’d like to show you another little way of using ATR.
Above is a chart of the dow jones Industrials with the 10 day ATR in the lower pane. What I have noticed is that high ATR readings (high volatility) usually takes place at market bottoms for the stock market. Of course I wouldn’t use ATR alone to forecast a bottom in the dow jones industrials, but it’s something that is worth following combined with other trading methods. What I find interesting is how the ATR just shot up to a high level just prior to the current rally in the market.
Below is a chart of the commodities index (CRB) with the average true range in the lower pane. We can use ATR on commodities too but it’s the complete opposite of stocks! Yes you read that correctly. Stocks tend to get more volatile at market bottoms whereas commodities tend to get more volatile at market tops!
This particular timeframe isn’t the best example I could have chosen but you can see that volatility increases at market tops not bottoms. Just look at any chart of the grains, cotton, sugar or coffee etc. All of their tops are accompanied by high volatility. At commodity lows we see low volatility whereas stocks will have high volatility.
So there you have it. This is how I use the average true range in my trading. I hope this helps.


