Introducing the Average Directional Index (ADX) The FX View
Post on: 16 Март, 2015 No Comment

Average Directional Index
The Average Directional Index (ADX), as well as the related Minus (-DI) and Positive (+DI) Directional Indicator are a set of directional movement indicators that are part of a trading system designed by Welles Wilder. The Average Directional Index was designed by Wilder with commodities and currencies in mind. But the indicator can be applied to a range of other financial instruments. The ADX measures trend strength, but not does not measure trend direction. The other two indicators mentioned above, the -DI and +DI are used alongside the Average Directional Index to help identify trend direction. By using these indicators together traders can both identify trend direction and trend strength.
The indicator was heavily featured in J. Welles Wilders 1978 book, New Concepts In Technical Trading Systems. The book has become particularly well known due to the fact it featured information on a number of now popular technical indicators including the Average True Range (ATR), the use of Parabolic SAR s and the Relative Strength Index . Even though these indicators were developed before the age of computerized trading, these indicators have stood the test of time and are used by many traders today.
Calculating the Average Directional Index and its sister indicators the +DI and -DI is very complex. With it being a subject that deserves an article all of its own. The calculation of the ADX is made more complicated by the smoothing used by Wilder. Thankfully, the majority of trading and charting programs will calculate the indicators for you. The important thing to take away is that the ADX establishes whether an instrument is trending. While the +DI and -DI, indicate the direction of any trend.
Identifying Trend Strength
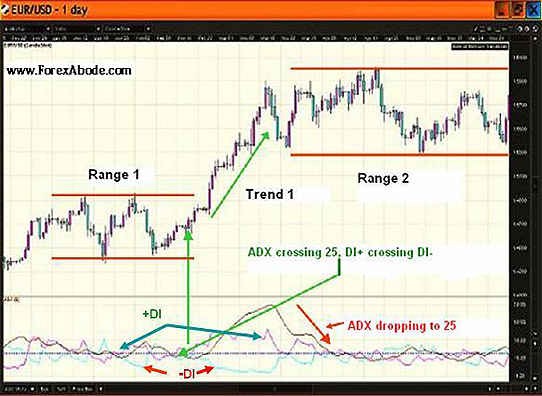
The ADX can be easily used to identify whether an instrument is currently trending. In Wilders 1978 book, he suggested that an instrument is strongly trending when the Average Directional Index gives off reading greater than 25. While readings below 20 indicate that the instrument in question is not currently trending. So on Wilders advice there is a slight grey area between 20 and 25, typically such a value is interpreted as signalling a weak or burgeoning trend. Due to the smoothing techniques utilized by Wilder, the Average Directional Index tends to suffer from a fair bit of lag. Many technical analysts use 20 as the key level when utilizing the indicator.
DI Crossovers: A Complete Trading Strategy
Using the ADX as well as the +DI and -DI indicators, Wilder proposed a simple trading system. Firstly Wilder required that the ADX value be greater than 25, meaning that prices are currently trending. Though it should be noted that many traders use 20 as the key level. According to Wilder a buy signal occurs when the +DI value rises above the -DI. Again according to Wilder, the initial stop loss should be set at the current days low. Traders should wait for this low to be penetrated before closing the position and admitting that the signal was mistaken. A buy signal is strengthened when the ADX continues to increase. Once the position has become profitable traders will need to incorporate a new stop loss and if the trend is to continue further traders should adopt a trailing stop.
A Sell signal occurs when the -DI rises above the +DI, while the ADX is greater than 25. In this situation Wilder suggests that you use the days high as your initial stop loss. Again if the bearish trend continues traders will be forced to change their stop loss, possibly incorporating a trailing stop loss should the trend continue for some time.
While calculating the ADX is particularly difficult, the interpretation of the indicator is pretty easy. The ADX can be used alone to determine either the strength of a trend or whether an instrument is trending. The ADX used alongside the -DI and +DI indicators can produce a simple to use crossover trading strategy. However, DI crossovers occur quite frequently and the lagging nature of the ADX indicator means that traders are often forced use to other indicators for confirmation purposes.


