How ETF Traders Can Use The VIX Index
Post on: 30 Апрель, 2015 No Comment

by Cory Mitchell on February 14, 2013 | Updated December 8, 2014
Investors and traders alike have surely run across the Volatility Index, commonly referred to as the VIX, in headlines from time to time. Many are quick to overlook this valuable indicator since they may not understand how it works, or how to use it to help forecast stock prices. However, this so-called fear index offers insight into the direction of stock prices, both as a confirmation signal and to aid in predicting stock market turning points
.What Is the VIX?
The Chicago Board Options Exchange (CBOE) Volatility Index (VIX) began trading in 1993, and is designed to measure the 30-day implied volatility of the S&P 500. The value is attained through calculations involving S&P 500 option contracts, which are bets based on the future value of the index [see How To Swing Trade ETFs ].
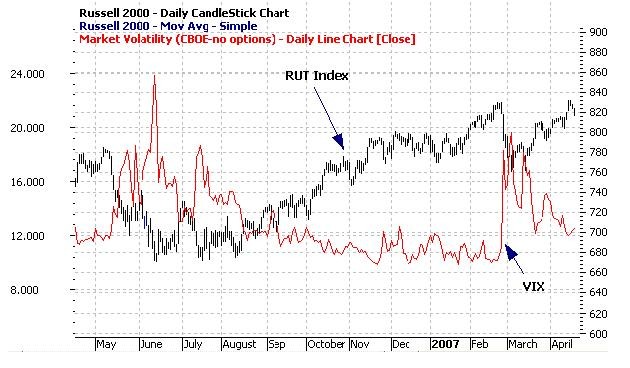
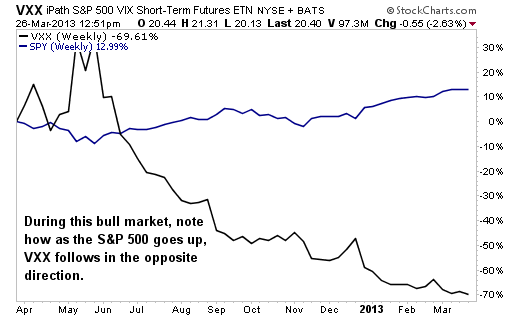
The VIX moves inversely to the S&P 500 Index. which is especially noticeable during fast market movements, or movements of large magnitude. For example, if the S&P 500 drops aggressively, the VIX Index will move aggressively higher. It’s for this reason the VIX has earned the name “fear index.
ETF traders can access the S&P 500 via the SPDR S&P 500 (SPY ),and the VIX index through the iPath S&P 500 VIX ST Futures (VXX ). Since small performance discrepancies can occur between an underlying index and the associated ETF, it is recommended for analysis purposes that the actual indexes are used, but the ETFs can be traded based on the index analysis [see ETF Technical Trading FAQ ].
How to Use the VIX
The VIX moves aggressively higher when there is a lot of fear in the market, and often the moves are not proportional to the move in the stock market. For example, a 10% drop in the stock market could cause a 30%, 40% or 50% rise in the volatility index. Therefore, while the VIX and S&P 500 have an inverse relationship, the VIX index can be far more volatile, especially during times of panic such as the 2008 financial crisis.
Figure 1 shows the inverse relationship of the S&P 500 and VIX. Notice the extreme levels reached by VIX; for example, the fear index rallied nearly 400% during 2008 while the S&P 500 fell approximately 50% off its highs.
Figure 1: S&P 500 vs. VIX Index (blue) Weekly Chart in Percentage Terms. Source: FreeStockCharts.com
Isolating Sentiment Extremes
When fear or complacency grips market participants to an extreme level, a reversal in the direction of the S&P 500 is usually close at hand. The VIX helps determine when such emotions are present [see 5 Most Important Chart Patterns For ETF Traders ].
Since 2007, a VIX reading between 15 and 10 has typically signaled that bullish investors are too complacent, and stocks are likely to turn lower. Unfortunately, since bull markets can last a long time it is quite possible to have a VIX reading between 15 and 10 for a sustained period. Figure 2 shows how the VIX traded near these extreme low levels for extended periods during 2006, 2007, 2011 and 2012. Therefore, traders must also watch for the VIX to move higher after it has reached this support levelwhen it does, it typically signals a move lower in stocks is coming or already underway.
When the VIX spikes aggressively higher, such fear usually doesnt last for long. News that panics the market is absorbed, rationalized, and then life goes on. Therefore, VIX rallies usually indicate that stocks are moving lower, but if the VIX reaches an extreme level (above 35) stocks will likely move higher in short order. Figure 2 shows the spikes in the VIX and how moves above 35 were followed by at least short-term rallies in the S&P 500 [see also Cheapskate Hedge Fund ETFdb Portfolio ].
Figure 2: VIX and S&P 500 Comparison Weekly Chart
Gauging Market Direction
Sentiment extremes help determine when a shift in market direction is likely. Extremely high VIX levels indicate a rally in stocks is likely due within short order; extremely low VIX levels signal complacency and that it is time to start watching for stocks to top out and proceed lower. But what about during the other times when the VIX isn’t showing an extreme? Well, the VIX also helps determine and confirm the direction of the stock market.

Figure 3 shows the significant trends that occurred in both the VIX and S&P 500 between late 2011 and the start of 2013.
Figure 3: VIX and S&P 500 Trend Comparison Daily Chart
The chart shows the VIX making a series of lower highs (downtrend) between October 2011 and March 2012. These lower highs in the VIX confirmed the strong rally that was occurring in the S&P 500. It was especially important since the VIX downtrend was occurring off an extreme high (above 35) and, as such, stocks were expected to move higher after such a pessimistic time [see 17 ETFs For Day Traders ].
In April, the VIX makes a higher low (uptrend), coupled with a lower high in the S&P 500. The two confirming signals indicated a new trend was underway in stocks and a further decline was likely.
In June, the VIX trend starts to move lower as investor fear declines, and when fear declines investors buy stocks.
Starting in September and October 2012, the VIX becomes much more range bound. During this time stocks moved lower. The VIX therefore did not confirm the move lower in stocks and signaled the decline in stocks was likely to be short-lived. It is important to note, taken in a broader context, even though the VIX did not confirm the move lower in stocks (called a “divergence” ) the VIX overall was near an extreme low and therefore buying stocks warranted some caution.
The Bottom Line
When determining stock market direction, the VIX is used to confirm moves in the S&P 500. Uptrends in stocks should be confirmed by a downtrend in the VIX; likewise, downtrends in stocks are confirmed by a rise in the VIX. When this relationships breaks down, the current direction of stocks is likely unsustainable for the short term, as happened in late 2012; however, market direction analysis must be used in conjunction with sentiment. When the VIX nears an extreme, the current trend in stocks is likely to tucker out. Extreme highs in the VIX typically call for a sharp reversal in stocks, while extremely low VIX readings mean further gains in the stock market are likely limited, but reversals are not necessarily imminent.
[For more ETF analysis, make sure to sign up for our free ETF newsletter or try a free seven day trial to ETFdb Pro ]


