Finding Value Using Price to Earnings Ratio
Post on: 2 Сентябрь, 2016 No Comment

Finding Value Using Price to Earnings Ratio
Start your Free Tomorrow In Review Preview — Sign Up Here: />
Stock screens can be the best way to find quality stocks for your portfolio, but often investors don’t know where to start. We aim to change that with another look at crafting the ultimate penny stock screen…
Last Friday. we talked about how to start building your penny stock screen using market capitalization and share price. We will use the first two metrics as a base for our future screens — this will keep us firmly planted in the small-cap universe.
Now that you have a pared down list of small-cap stocks, I can to introduce you to one of the most widely used — and often misused — metrics for your screen: the price to earnings ratio or P/E ratio .
Despite its popularity, the P/E ratio is commonly misused because investors often aren’t sure exactly how to interpret this seemingly innocuous number. While I would never recommend using this metric on its own, today, I will give you an introduction to start adding this metric as a component to your screens.
The P/E ratio is calculated by taking the share price, and dividing it by the earnings per share (EPS).
A company’s EPS serves as an indicator of its profitability; it is the profit allocated to one share of the company’s stock. EPS can be found by taking a company’s net income and dividing it by the number of outstanding shares. For that reason, the P/E ratio is essentially a measure of how much investors are willing to pay for each dollar of a company’s earnings.
Now that you know how to find the P/E ratio, you need to know how to interpret it.
Before we add this metric to our screen, there are some important details I should note…
When calculating a company’s P/E ratio, earnings are obviously a main factor. It’s important to know, however, that earnings can be subject to manipulation. For instance, a company’s reported earnings can include non-cash items like depreciation, amortization, and unrealized investment losses — those numbers can be discretionary, and they have a direct impact on our ultimate price-to-earnings results.
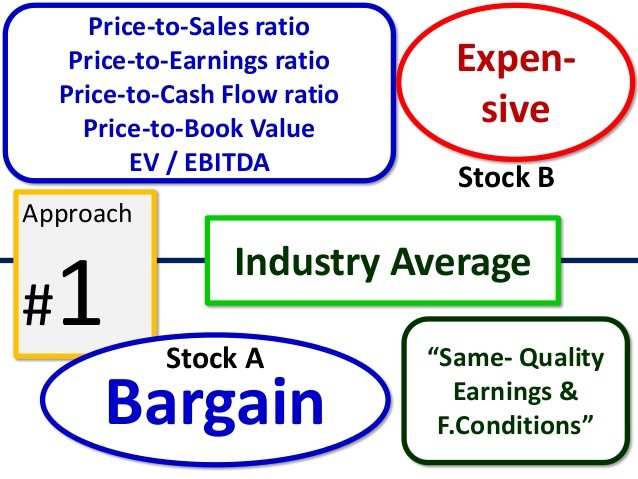
The P/E ratio can also vary by industry. In the current market, industries like technology and retail tend to have a higher P/E ratio than others. For example, Apple’s (NASDAQ: AAPL ) P/E ratio is 19.23 while Exxon Mobil’s (NYSE: XOM ) is 13.45. Each of these companies is in a different industry, so comparing their P/E ratios would be like comparing apples to oranges. When using P/E ratio to compare one company to another it is important to make sure you are comparing companies within the same industry. You can even go a step further and compare a company to the industry’s average (which you can find on investment research sites like Yahoo Finance ).
Because the P/E ratio is subject to these variables, it should be used as a guideline with other metrics. You can’t pinpoint the exact value of a company by this metric alone.
Since, as I said before, the P/E ratio essentially measures how much investors are willing to pay for each dollar of a company’s earnings, it’s a good indicator of the valuation of a company.

There are many different ways to interpret what a company’s P/E ratio means. A lower P/E ratio can mean that a stock is undervalued, but it can also mean that investors believe that the company’s earnings are set to decline. Stocks that have a higher P/E ratio are thought to be overvalued or could see growth in the future.
As you can see, using the metric won’t give you a concrete answer to the value of a specific stock, but is a crucial starting point.
Since we are building our stock screen to provide us with penny stocks set for moderate to deep-value, we will restrict our screen to stocks with P/E ratios greater than 8 but less than 20. This range keeps us focused on cheap or reasonably-priced stocks that strike a fairly broad range of industries.
Like I’ve mentioned, the P/E ratio is not cut and dry. Understanding reasonable P/E values is something that’ll come with time as you hone your analysis abilities — and you should adjust this metric depending on what you are looking for.
Here’s a look at our penny stock screen as it currently stands:
Now you should be left with about 170 small-cap companies, eliminating companies with a higher earnings multiple than we are willing to pay.
Remember, because of all the variables that can affect P/E ratio, this metric should not be used alone. Next week I will be back with the next metric, price-to-book ratio (P/B ratio), to add to your screen. You are one step closer to a manageable watch list of your own.


