DIFFERENCE BETWEEN TRAILING P
Post on: 1 Май, 2015 No Comment

DIFFERENCE BETWEEN TRAILING P/E AND FORWARD P/E
One of the bits of information you see in most stock snapshots is the P/E which is the price to earnings ratio. Almost always, the number you see will be the trailing P/E (also called trailing twelve months/TTM) because it is the ratio of the price of the stock divided by the companies earnings per share over the last 12 months. The number you see will go up and down depending on the movement of the stock price and then it will also change when new earnings are announced.
There is also something called the forward P/E but you will rarely see that number in any stock snapshot. If you decide that the forward P/E is something you want to consider before you buy stocks. you are most likely going to have to calculate the number yourself. The forward P/E is the stock price divided by per share earnings estimates for the next 12 months.
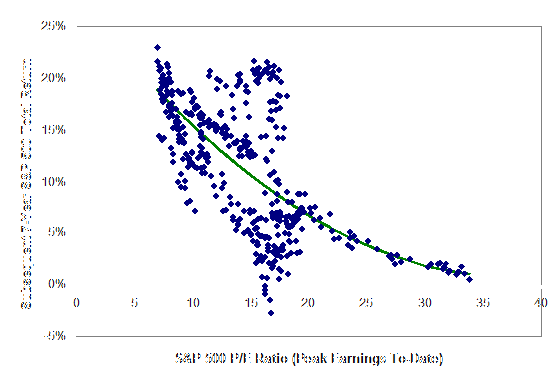
Very generally speaking, the lower the P/E number you see for a company, the better. You want to see the price of a stock low and the earnings high which would give you a lower P/E number. A high P/E number means you are paying more money per share for earnings and that can sometimes increase the risk.
Looking at the P/E number for any company by itself is usually not too meaningful. It becomes a better indicator when you compare P/E ratios of companies that are in the same INDUSTRY. For instance, comparing the price to earnings ratio of JPM (banking) to Starbucks (restaurants) is like comparing apples to oranges: different industries often have different average P/Es. In order to find out whether the stock you are interested buying has a high or low P/E, you need to find out what its competitors P/Es are. Then you will be able to make a more educated interpretation of the ratio and determine whether it is on the low or high side.
Stocks that have lots of momentum behind them often have high price to earnings ratios. Such a stock right now would be Netflix (NFLX) with its P/E over 55 even after having come down about 25% from its highs. In cases like these, people can be so bullish about a stocks future prospects that they bid it up to dangerous highs. They get so focused on the company becoming a run a way hit that they throw out all normal stock valuation models.


