A tale of two depressions What do the new data tell us February 2010 update
Post on: 16 Март, 2015 No Comment

- Global industrial production now shows clear signs of recovering.
This is a sharp divergence from experience in the Great Depression, when the decline in industrial production continued fully for three years. The question now is whether final demand for this increased production will materialise or whether consumer spending, especially in the US, will remain weak, causing the increase in production to go into inventories, leading firms to cut back subsequently, and resulting in a double dip recession.
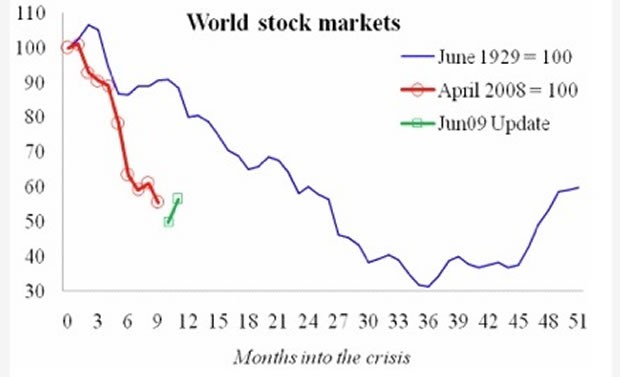
- Global stock markets have mounted a sharp recovery since the beginning of the year. Nonetheless, the proportionate decline in stock market wealth remains even greater than at the comparable stage of the Great Depression.
- The downward spiral in global trade volumes has abated, and the most recent month for which we have data (June) shows a modest uptick. Nonetheless, the collapse of global trade, even now, remains dramatic by the standards of the Great Depression.
Figure 1. World industrial production, now vs then
Figure 2. World stock markets, now vs then
Figure 3. Volume of world trade, now vs then
Figure 5. Industrial output, four big Europeans, then and now
Figure 6. Industrial output, four non-Europeans, then and now
Figure 7. Industrial output, four small Europeans, then and now
Editor’s note: The 6 April 2009 Vox column by Barry Eichengreen and Kevin O’Rourke shattered all Vox readership records, with 30,000 views in less than 48 hours and over 100,000 within the week. The authors will update the charts as new data emerges; this updated column is the first, presenting monthly data up to April 2009. (The updates and much more will eventually appear in a paper the authors are writing a paper for Economic Policy .)
New findings:
- World industrial production continues to track closely the 1930s fall, with no clear signs of ‘green shoots’.
- World stock markets have rebounded a bit since March, and world trade has stabilised, but these are still following paths far below the ones they followed in the Great Depression.
- There are new charts for individual nations’ industrial output. The big-4 EU nations divide north-south; today’s German and British industrial output are closely tracking their rate of fall in the 1930s, while Italy and France are doing much worse.
- The North Americans (US & Canada) continue to see their industrial output fall approximately in line with what happened in the 1929 crisis, with no clear signs of a turn around.
- Japan’s industrial output in February was 25 percentage points lower than at the equivalent stage in the Great Depression. There was however a sharp rebound in March.

The facts for Chile, Belgium, Czechoslovakia, Poland and Sweden are displayed below; note the rebound in Eastern Europe.
Updated Figure 1. World Industrial Output, Now vs Then (updated)
Updated Figure 2. World Stock Markets, Now vs Then (updated)
Updated Figure 3. The Volume of World Trade, Now vs Then (updated)
Updated Figure 4 . Central Bank Discount Rates, Now vs Then (7 country average)
New Figure 5. Industrial output, four big Europeans, then and now
New Figure 6. Industrial output, four Non-Europeans, then and now.
The parallels between the Great Depression of the 1930s and our current Great Recession have been widely remarked upon. Paul Krugman has compared the fall in US industrial production from its mid-1929 and late-2007 peaks, showing that it has been milder this time. On this basis he refers to the current situation, with characteristic black humour, as only “half a Great Depression.” The “Four Bad Bears ” graph comparing the Dow in 1929-30 and S&P 500 in 2008-9 has similarly had wide circulation (Short 2009). It shows the US stock market since late 2007 falling just about as fast as in 1929-30.
This and most other commentary contrasting the two episodes compares America then and now. This, however, is a misleading picture. The Great Depression was a global phenomenon. Even if it originated, in some sense, in the US, it was transmitted internationally by trade flows, capital flows and commodity prices. That said, different countries were affected differently. The US is not representative of their experiences.
Our Great Recession is every bit as global, earlier hopes for decoupling in Asia and Europe notwithstanding. Increasingly there is awareness that events have taken an even uglier turn outside the US, with even larger falls in manufacturing production, exports and equity prices.
In fact, when we look globally, as in Figure 1, the decline in industrial production in the last nine months has been at least as severe as in the nine months following the 1929 peak. (All graphs in this column track behaviour after the peaks in world industrial production, which occurred in June 1929 and April 2008.) Here, then, is a first illustration of how the global picture provides a very different and, indeed, more disturbing perspective than the US case considered by Krugman, which as noted earlier shows a smaller decline in manufacturing production now than then.
Figure 1. World Industrial Output, Now vs Then
Source: Eichengreen and O’Rourke (2009) and IMF.
Similarly, while the fall in US stock market has tracked 1929, global stock markets are falling even faster now than in the Great Depression (Figure 2). Again this is contrary to the impression left by those who, basing their comparison on the US market alone, suggest that the current crash is no more serious than that of 1929-30.
Figure 2. World Stock Markets, Now vs Then


