What is Implied Volatility
Post on: 6 Июнь, 2016 No Comment

Implied volatility is the market’s estimate of how much a security will move over a specific period of time. Generally implied volatility is related in percentage terms and is a reflection of a securities potential movement on an annualized basis. Implied volatility is used in many formulas such as the Black Scholes options pricing model as well as VAR to assist in valuing securities and evaluating risk.
Volatility is a measurement of how much a security has changed on a historical basis and is calculated using the standard deviation of the security over a specific period of time. Implied volatility is the markets estimate and is driven by market participants.
Options
Implied volatility is one of the major inputs used by traders to price premiums for binary options . Since an option is the right but not the obligation to purchase (or sell) a security at a certain price on or before a specific date, it is priced by how likely it will be in or out of the money by a specific date. The likelihood is based on the current price, the strike price, current interest rates, and an estimate of how volatile the security is at the current time. This likelihood is expressed in terms of implied volatility.
For example, if a security has an implied volatility that is 20%, a strike price that is only 5% away will likely be reached in 1 year and therefore the premium will reflect that likelihood. If the implied volatility on the other hand is 5% and the strike price is 20% away, the premium will be lower based on the idea that it is unlikely the stock will be above (or below) the strike price.
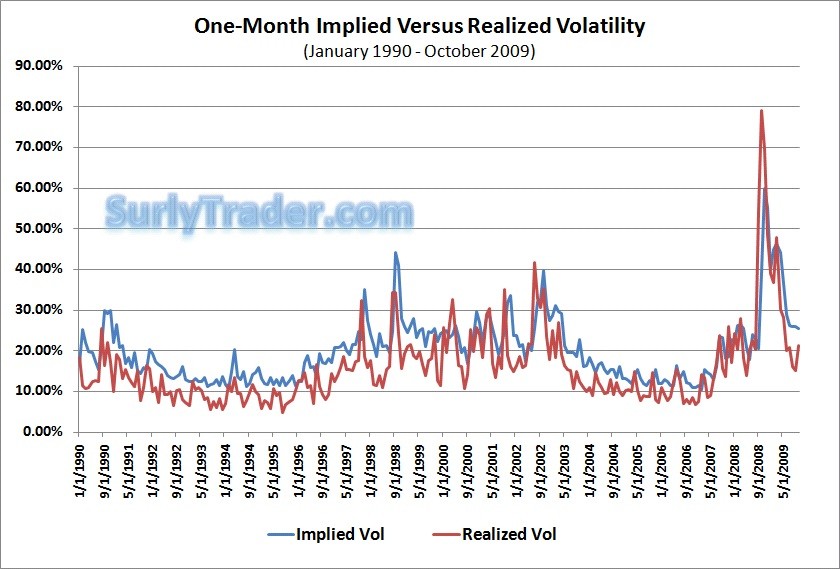
High levels of implied volatility reflect a market condition where fear is prevalent and traders believe that a security will move violently, while low levels of implied volatility reflect a market condition where complacency is dominant.

To track the potential direction of implied volatility, investors use historical implied volatility and chart its path similar to the way they would chart a security when financial trading. The most popular index which tracks implied volatility is the VIX volatility index.
The VIX volatility index measures the implied volatility of nearby S&P 500 at the money options. The VIX trades as a futures contract, as well as in an ETF format. The VIX can be used to hedge a portfolio that is similar to the S&P 500 index as premiums for option generally increase during adverse changes to a stock index. For example, the VIX will generally climb as the S&P 500 moves lower, and declines as the S&P 500 moves higher.
When purchasing options, an investor should understand that what he or she is really purchasing or selling is the chance that a security will be in or out of the money. This chance is priced by professionals, and most options expire out of the money. With this in mind, an investor should chart volatility on a graph when considering a purchase and determine if the current level of implied volatility is rich or cheap.
3A%2F%2F0.gravatar.com%2Favatar%2Fad516503a11cd5ca435acc9bb6523536%3Fs%3D90&r=G /%


