CBOE s Volatility Index (VIX)
Post on: 17 Сентябрь, 2015 No Comment

by Wayne A. Thorp, CFA
Over the last couple of years, a great deal of attention has been paid to the Chicago Board Options Exchange CBOE Volatility Index, or VIX for short. Wayne A. Thorp, CFA, editor of Computerized Investing. explains what this indicator is and how to use it. Subscribers to CI have access to a regular column called Technically Speaking that explains chart types, trendlines, and indicators such as the VIX. You can follow Wayne on Twitter @CI_Editor .
What the VIX Measures
The VIX is a measure of the implied or expected volatility of S&P 500 options over the next 30 days. Implied volatility is the markets estimated future volatility and is reflected in the premiums paid for options.
Originally launched in 1993, the VIX underwent a change in calculation in September 2003. The original VIX was calculated using at-the-money put and call options on the S&P 100 index OEX. Furthermore, the original VIX was based on prices of only eight at-the-money OEX puts and calls, the most actively traded index options at the time.
By 2003, the S&P 500 index SPX option market was the most actively traded option market, while trading volume in OEX index options had fallen off significantly. Also, portfolio managers were using options more as a means of insuring their portfolios, specifically with out-of-the-money and at-the-money index puts. Therefore, the new VIX calculation includes put and call options with a wide range of strike prices, including those in-the-money, at-the-money and out-of-the-money.
Investor Fear Gauge
The CBOEs VIX microsite (www.cboe.com/micro/vix ) states that: Since volatility often signifies financial turmoil, VIX is often referred to as the investor fear gauge.
One way to look at the VIX is as a measure of what investors are willing to pay to hedge their equity portfolios using S&P 500 index options. As put options have become a popular method of hedging portfolios, a rise in the VIX is seen as a signal that investors are becoming increasingly worried about downside volatility in the market.
The buyer of a put option acquires the right (but not the obligation) to sell the underlying instrumentin this case, the S&P 500 index or an index exchange-traded fund ETF such as the S&P SPDR SPY for a predetermined price during a specified period of time. If the option buyer exercises their right, the seller of the put is obligated to buy the underlying instrument from them at the agreed upon strike price, regardless of the current market price. As a hedging strategy, an investor would buy put options to offset the potential loss in their stock portfolio if they expected the market to decline. While the value of the investors equity portfolio would more than likely fall with the overall market, the value of the put option would gain in value as the market fell.
Using the VIX
The VIX is watched closely by short-term investors and traders. It is a forward-looking indicator and measures the volatility investors expect to see in the near future. However, there is much debate as to how exactly an investor can use the VIX, and the degree to which its use is beneficial.
Many investors monitor the VIX because it provides useful information about investor sentiment. Like many other sentiment indicators, investors use the VIX to identify possible market turning points. However, also like most sentiment indicators, the VIX isnt good at identifying exact market tops and bottoms.
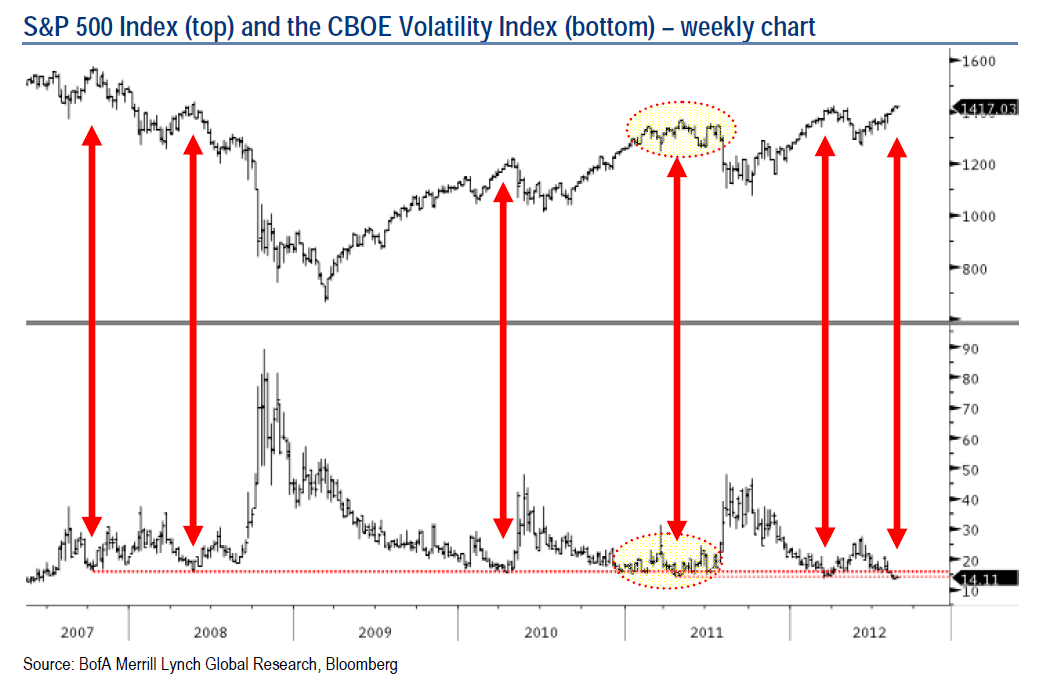
Though there has been an inverse relationship between the VIX and the S&P 500 indexhigh levels of the VIX have generally indicated market bottoms and low levels market topsthe relationship between the VIX and the S&P 500 did weaken during the 2008 market downturn.
In June and July 2008 the VIX rose nearly 50% while the S&P dropped nearly 13%. The VIX started its sharp climb to historic levels in late August, eventually peaking at 89.53 on an intraday level on October 24, 2008. During this same time, the S&P lost nearly a third of its value. Past history had shown that extreme levels in the VIX indicated market reversals. While the S&P 500 did rally 18% over the next the seven days, the stock index reversed course and continued its decline even while the VIX fell dramatically from its October and November highs. When the market eventually did find its footing in early March 2009, the VIX was nearly 50% off its October and November 2008 highs.
Then, in September and October of 2009, the S&P 500 hit successive intermediate highs even while the VIX was matching previous highs or reaching new ones.
Conclusion
Seeing how the apparent relationship between the VIX and the S&P 500 has deteriorated over the last couple of years, I would be hesitant to use it as a timing mechanism. Recent history has shown that the market can continue to fall even as the VIX is dropping dramatically (or continue to rise when the VIX is hitting new near-term highs). If you have your mind set on buying when you see the VIX hitting intermediate-term highs, at a minimum you may want to wait for a market pullback.
Like all indicators, the VIX is only one piece of the puzzle. It is best to use it along with other market measures and wait for confirmation from multiple sources before acting.

Wayne A. Thorp, CFA is a vice president and senior financial analyst at AAII and editor of Computerized Investing. Follow him on Twitter at @WayneTAAII .
Discussion
Jerome from TX posted over 4 years ago:
Good article, but forgone conclusion. Never rely on any one indicator. AAII has repeated that over the years.
Mercere from TN posted over 4 years ago:
Everyone’s always tring to determine when to buy and when to sell. I’ve been stopped out, ridden the elevator up & down, sold too soon or too late, and occasionally hit the ball on the screws.
It seems like the two best pieces of advice I’ve heard is that It’s hard to lose money taking a profit, and Pigs get fat & hogs get butchered!
That said, I’m always open to new advice and information!
Steven Sears from IA posted about 1 year ago:
A few years ago I bought VXX on the 3rd of July and sold on the 5th of July. I made enough to buy a box of bottle rockets. But I have since learned that volume and volatility are not at all the same thing. Lady Luck is a cruel mistress.


