The Time Value of Money
Post on: 16 Октябрь, 2015 No Comment

The time value of money (TVM) is the basic mathematics of investing and is the basis of all financial calculations. Most importantly, it explains the concept of compound returns, which causes investments to grow exponentially over time. An understanding of the time value of money is crucial to understanding the expected and actual returns on investments and analyzing past returns on investments. It’s something every investor should know well, and being armed with a good financial calculator will help. Financial calculators are indispensable to investors when it comes to doing anything that involves the time value of money.
Return can be the interest earned on a bond, the rate of return realized on a stock or mutual fund over its holding period, the rate of return a corporation earns on invested capital and more. In finance, the letter r is used to represent the rate of return. In some references you will find the letter k is used instead of r. Unfortunately, no one told the calculator manufacturers about this. You’ll usually find that i is used instead of r on financial calculators. In the interest of continuity and because r is a more logical representation of return than k, I have used r.
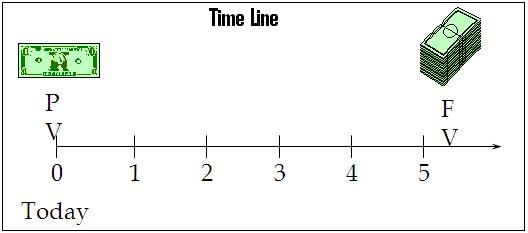
FV = Future Value after n periods
PV = Present Value
r = Periodic rate of return
n = Number of compounding periods
This formula computes the future value (FV) of a current amount (PV) earning a compound rate of return r for n periods. Compounding can also be continuous, but that requires a formula that is derived by solving an infinite series. You’ll find that formula farther down this page.
Although we tend to think of returns as being annual returns, the compounding period can be any fixed duration, such as days, weeks, months or years. For instance, you’ve probably noticed that the APR of monthly credit card interest is greater than 12 times the monthly rate. That’s explained by the fact that the compounding period is monthly. If the monthly rate is 1.5%, then the APR will be 19.56% which is greater than 12 x 1.5% = 18.00%.
(1 + 0.015) 12 -1 = 0.1956 = 19.56%
The 1 in the formula represents the beginning value, thus it must be subtracted to find the compound return, which in this case is the credit card company’s return.
This formula can be used to compare investment opportunities. Suppose you have the option of investing in one of two mutual funds which are identical in every respect except the management fees they charge. Both funds have a ten year historical rate of return of 12% and they also have identical standard deviations (risk). However, fund B charges an annual management fee of 1.25% but fund A only charges 0.75%. (Of course, the usual disclaimer applies: Past performance is not necessarily indicative of future results.) As the two funds are equal in every way except the management fee and management fees must be deducted from performance to determine return, you will obviously choose fund A. So lets see how much better you’ll do over the years with fund A assuming your initial investment is $10,000, that the funds’ future performance is equivalent to their past performance and all distributions are reinvested.
There are a few things you should note about this example.
- Both curves are upward-sweeping, i.e. they are exponential curves.
- In both cases, the value of your investment increases at an increasing rate, which is expected given the basic time value of money formula for compound return.
- The 0.50% difference in management fees results in an 11.9% difference in the value of the investments after 25 years.
- The 11.25% compound rate of return causes fund A to grow to $143,714 in 25 years, which is a total return of $133,714 or 1337%, compared to 1184% for fund B.

Here’s how the total return on fund A looks in the compound return formula, where ROI = return on investment:
FVn = PV(1 + r) n = $10,000(1 + 0.1125) 25
= $10,000 x 14.37 = $143,714
$143,714 — $10,000 = $133,714 Total ROI
$133,714 ÷ $10,000 = 13.37
13.37 x 100% = 1337% Total ROI
That, ladies and gentlemen, is the power of compounding. With time, compounding will turn a modest investment into a tidy sum and a small difference in the rate of return can become a significant gap. I can’t overemphasize the importance of these two points to you as investors.
The following chart shows how the value of the S&P 500 index has grown exponentially since 1950. (The value of the index is net of dividends.)
Click on the chart for a full-screen view. (pdf file opens in new window.)
The red line was plotted from the actual values of the S&P 500 index at the end of each month. The blue line is what the index would have been if the rate of return had been constant over the period January 1950 through September 2007 and reflects a compound annual rate of return of 8.13% computed from monthly returns. The average annual return for the period was 8.84%, also computed from monthly returns. (The difference in these two numbers is explained in the subsection on mutual fund returns .) In 57 years and nine months, the S&P 500 grew from a value of 16.71 to 1526.75, which is an excellent example of the power of compounding. The dividend yield would add approximately 2% to each of these returns, thus making the compound growth of an investment in the index even greater than growth of the index itself.
You should note that the compound return formula works in reverse.


