Introduction to the Stretch Concept in Day Trading Crude Oil Futures
Post on: 16 Март, 2015 No Comment

By Mike Wilt
I was introduced to the Stretch concept by Tony Crabel. I have always been intrigued by its concept but have struggled to implement it consistently into my trading plan. Perhaps with the great trading minds in the room, we can all use it to its fullest potential.
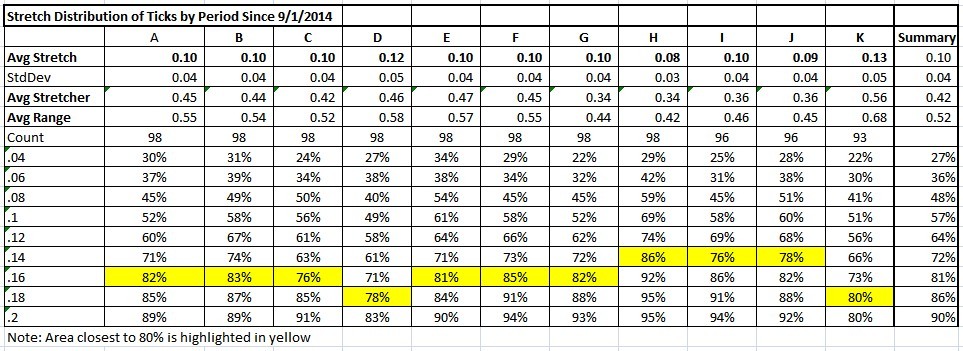
The simple way to calculate Stretch is to measure the number of ticks from the open to the low (open — low) and from the high to the open (high — open). The smaller of these 2 calculations is Stretch (green shaded area in the image above). You then make this calculation for a larger number of days or periods and you come up with an average and a standard deviation for this larger string of numbers. The table below is a summary of the Stretch and standard deviations for each 30 minute segment we trade during the pit session. It also includes summary range data for the 11 30-minute periods we trade. I have also attached a portion of the spreadsheet I use. Notice that with the exception of Special K (period 11) there is no period with a Stretch > .25. This is universally true throughout days and days of data (generally 2 standard deviations).
How to Use Stretch

This is what I think about Stretch. The opening of the bar is the most important number. If you think about the price action around the Open, it can go above, below, above, below before finally going in one of the directions with some force. Stretch is simply telling us, on average, what the smallest of the distances from open has been for your population of data. Tony Crabel suggests taking the trade in the direction once price has moved past the Stretch limit. So for period 1 if it Opens at 64.00, goes up to 64.05 and then goes down to 63.70, Tony suggest selling at 63.90 (1 tick beyond the average Stretch of .09). He would have his stop at 64.10 (1 tick beyond Open + Stretch).
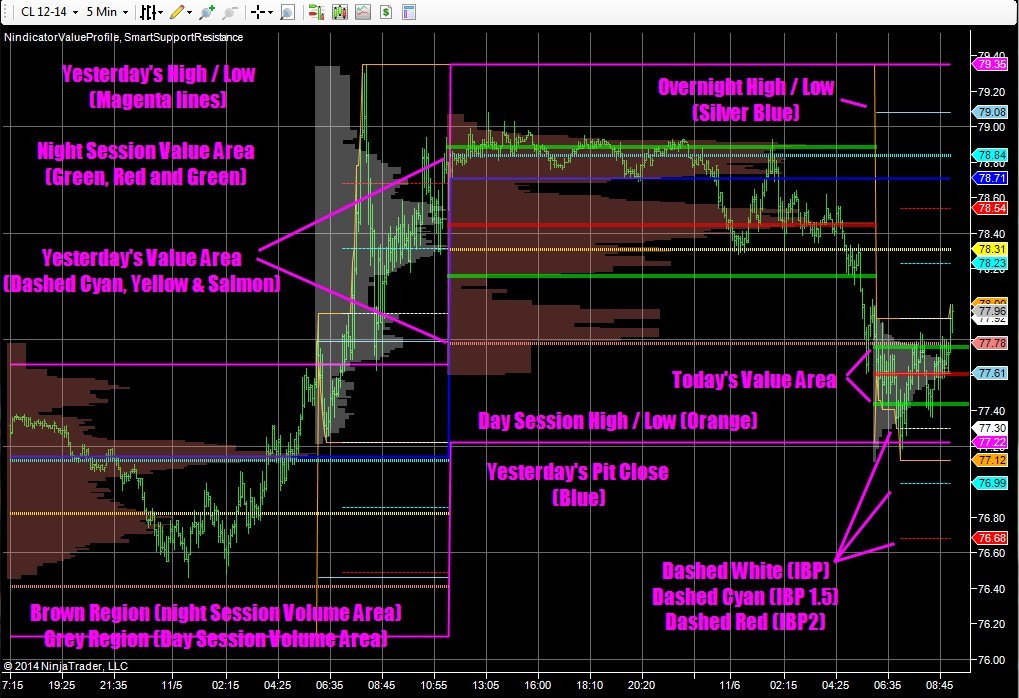
There are several other strategies for using these numbers which I will describe in greater detail later after they are better validated. I will leave you with this to think about. Say other indications you follow suggest you want to go long in Period 4. Price opens at 64.00 and goes down to 63.79 (.21 from open) and you notice the VAL and Half back are right at 63.75. 2 standard deviation says that 95.45% of the time price will not go (in this case .31 ticks) and remain Stretch for this period. The average range is .51 for this period so it is possible for the low to be Stretch. In my opinion, entering at .21 with other supporting rationale to go long is a statistically valid position to take. I certainly would not be long from here on the merits of Stretch alone.
Stretch has been a confusing concept for me to implement. It has been a long time goal to apply this intriguing concept consistently in real trading. I hope it is clearer for you now.


