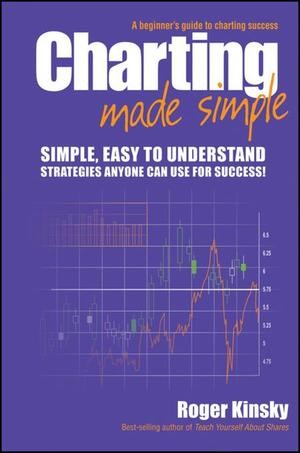
Technical Analysis A Beginner s Guide
Post on: 6 Октябрь, 2015 No Comment

Psychology of Candlesticks
Candlestick charts can provide tremendous insight into the psychology underlying the market in a particular security. For example, Figure 1 shows a doji star pattern that is indicative of a near-term reversal in price. The narrow daily price range and even closing price signals that the market is unsure of future direction, which means that the security may be ready for a move in the opposite direction.
Figure 1 – Doji Star Candlestick Reversal – Source: StockCharts.com
There are many different candlestick patterns that are commonly used by market technicians, including bullish/bearish engulfings, long/short shadows, spinning tops, hammers, and several others. Each pattern has a specific meaning that’s backed by market psychology, which traders can use to predict likely future price movements and ultimately increase their risk-adjusted returns.
Here are some tips to keep in mind when using candlesticks:
- Look at the Past : Candlestick charts provide insights into market psychology, but should always be analyzed in the context of larger bigger picture trends occurring in the prior candlesticks.
- Seek Confirmation: Candlestick patterns can be somewhat unreliable as a sole indicator, which means that traders should look for confirmations in chart patterns and other types of technical analysis.
Reading Chart Patterns
Candlestick charts are great for interpreting near-term price action, but traders looking for longer-term swing trades may need to look at the bigger picture. Multiple days, weeks, or months of price patterns can provide additional insights into long-term price trends and areas of support or resistance. For example, Figure 2 shows an ascending triangle pattern that led up to a breakout.
Figure 2 – Technical Breakout Pattern – Source: StockCharts.com
There are many different types of chart patterns that traders use in order to identify areas of support, resistance, breakout, or breakdown potential, including ascending triangles, price channels, rising/falling wedges, flags, and many more. Each chart pattern has a specific implication of what may happen in the future, which traders can leverage in order to improve their risk-adjusted returns [see also Moving Average Trading Strategies: Do They Work? ].
Here are some tips to keep in mind when reading chart patterns:
- Multiple Timeframes: Traders should look at multiple timeframes (e.g. daily, weekly, monthly, and yearly) in order to determine the overall trend and ensure that they are staying on the right side of the trade.
- Watch False Breakouts: Chart patterns may predict a breakout that materializes, but traders shouldn’t let their guard down, since false breakouts can also occur and generate losses.
Using Statistical Indicators
Traders often use technical indicators as a confirmation or gauge of a trade’s strength. For example, Figure 3 shows a stock that’s rebounding from a trend line support, but the technical indicators suggest that a breakdown remains a good possibility. A trader may analyze the situation and decide that the trade is too risky given the weak technical indicators even if the chart pattern looks promising.
Figure 3 – Bad Technical Indicators – Source: StockCharts.com
There are many different types of statistical indicators available for traders to use to determine everything from trend strength to reversal potential, including relative strength indexes, moving averages, moving average convergence and divergence, and stochastics. Each of these technical indicators has a specific purpose and can even be used in the context of a trading system to generate buy and sell signals.
Here are some tips to keep in mind when using statistical indicators:
- Consider Context: Technical indicators should never be used without putting them into context by looking at the bigger picture, including chart patterns, candlestick patterns, or even other technical indicators.
- Get a Feel for It: Some technical indicators are rather esoteric, requiring traders to develop a feel for them before using them, which means that traders should paper trade these strategies before taking the plunge.
Online Resources
There are many different online resources available for market technicians looking to analyze securities. While many brokerage platforms offer comprehensive solutions, several websites provide automated technical trading ideas and platforms designed to enable easier sharing with peers for free. Traders should consider using both of these types of resources when analyzing securities.
Some popular websites include:
- StockCharts.com : Free stock charts with a variety of different technical indicators, chart patterns, and chart types.
- Finviz.com : Free resource for breakouts, breakdowns, and chart patterns that are automatically derived every trading day.
- StockTA.com : Free resource for traders looking for chart pattern analysis and other technical indicators updated on a daily basis.
- StockTwits.com : Free community of active traders and source of trading ideas and due diligence for any level of trader.
The Bottom Line
Technical analysis provides a great way for traders to objectively consider where a security’s price may be headed in the future based on its past performance. While these insights are never 100% reliable, they can help when determining when and at what price a trade could be made in order to optimize risk-adjusted returns. Multiple types of technical analysis should be used when developing a trade idea.
For example, a complete technical trade might involve a trader looking at a security’s price chart and seeing a durable uptrend across multiple timeframes. Upon further analysis, the trader may find an ascending triangle pattern showing a key breakout point that’s confirmed with technical indicators. The final buying decision may come after a bullish engulfing occurs in the candlestick chart.
In the end, technical analysis provides tools to help improve risk-adjusted returns, but it should be just one tool in a trader’s diverse toolbox.
If you’ve enjoyed this article, sign up for the free TraderHQ newsletter ; we’ll send you similar content weekly.


