Japanese Candlestick Chart Patterns
Post on: 30 Июль, 2015 No Comment

Futures trading bar charts, Japanese candlesticks show price movements
Like bar charts, candlesticks show price movements over time but differ from these in the representation of the bar. Candlesticks have colored ‘bodies’ which represent the range between the opening and closing price for that particular time period.
The color represents either the downward or upward movement of price. White bars are ‘up’ days, meaning the closing price is higher than the opening price. Black bars are ‘down’ days, meaning the closing price is lower than the opening price.
The little sticks above or below the bodies represent the highest and lowest prices achieved in that time period. Candlestick patterns can consist of one or several individual candles. Like bar charts patterns, candlestick patterns can be used to forecast the market. Because of their colored bodies, candlesticks visually represent greater detail in their chart patterns than bar charts.
Continuation Patterns (1 or more candles) Definitions
A candlestick which has little or no upper or lower sticks. A Marubozu with a large body and small or no sticks is a very strong indication that current trend will continue, especially if body color confirms existing trend.
A candlestick which has a big difference in opening and closing prices compared with previous trading days. A Long Day indicates a strong trend continuation especially if body color confirms existing trend.
A candlestick which has a small difference in opening and closing price compared with previous trading days. A Short Day indicates a weaker continuation in trend.
Two consecutive white bodies have the same range, shows failure to reverse.
>Separating Lines
A second candle opens outside of the first candle’s body, and is the same color as the existing trend, indicates no retesting of previous prices (failure to reverse) and a strong movement in trend direction.
Reversal Patterns (1 or more candles) Definitions
A candlesitck which has no real body (open and close are the same). A long legged doji has long upper and lower sticks. A gravestone doji has a long upper shadow and no lower stick. A dragonfly doji has no upper stick and a long lower stick. A Doji indicates potential change in market direction
>Paper Umbrella
One candle indicates potential change in market direction
Second candle body engulfs previous candle, and is the opposite color of existing trend shows a successful test of previous range
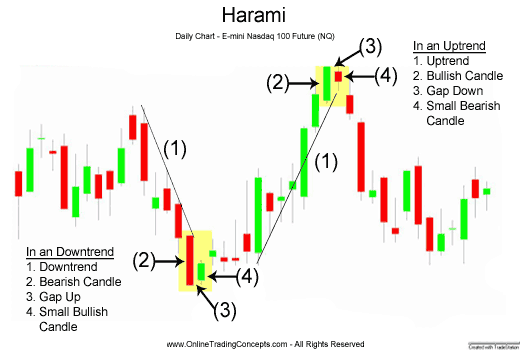
A candlestick which has a small real body that gaps above or below a long candlestick occurring the previous day. While a Doji Star occurs outside the previous candle’s body and in line with existing trend, it is a reversal pattern since it has no real body.
>Hammer, Hanging Man
These candlesticks are reversal indicators which consist of a small real body at the one end of the trading range (body color is not important), a long lower stick twice the height of the real body and no, or a very short, upper stick. The part of the trading range in which they occur determine what type of reversal these indicate;hammers occur at the bottom of the range and are bullish, while hanging man occur at the top of the trading range and are bearish.
>Shooting Star, Inverted Hammer
These candlesticks are reversal indicators which consist of a small real body at the one end of the trading range (body color is not important), a long upper stick twice the height of the real body and no, or a very short, lower stick. The part of the trading range in which they occur determine what type of reversal these indicate;inverted hammers occur at the bottom of the range and are bullish, while shooting star occur at the top of the trading range and are bearish.


