Chapter 06 Technical Indicators MACD Stochastics Williams R% RSI Bollinger Bands
Post on: 23 Октябрь, 2016 No Comment

There are tons of technical indicators being used by traders. All indicators are derived from basic information from the stock market: price and volume.
Those indicators can be grouped as 2 major categories: momentum and trend.
Momentum indicators measure the strength of the current price action movement to predict likely future price changes.
Trend indicators measure the trend of price action, then predict the strength of current trend, and predict the tendency of the trend continuing or breaking in the future.
Some of the most popular indicators are: MACD, Stochastics, Williams R%, RSI, Bollinger Bands.
MACD can be used as both momentum and trend indicator. There are three ways to interpret MACD signals:
1. MACD lines slope signal current trend.
2. MACD lines position signal current active trend: bullish (if above zero line) and bearish (if below zero line).
3. MACD lines difference determine current price action momentum.
Stochastics is a momentum indicator which measure how far the price action movement from recent price action range. When price move closer to the high range, it tends to move lower in the future. When price move closer to the lower range, it tends to move higher in the future. Stochastics doesnt predict that price must go either up/down, but it just signal possible move as the price is closing on the recent range. In strong trending market, price can stay on the edge of the range indefinitely regardless stochastics signals. Stochastics best used on ranging market, but during trending market it tends to produce a lot of whipsaw signals.
Williams %R signals work like stochastics in a more simplistic ways, thus its best suited to shorter timeframe.
RSI is a momentum indicator measuring the strength of current price action movement. RSI assumes that difference in price changes will signal the likelihood of future price action. RSI takes this as momentum signal. If the changes is accelerating, the RSI predicts that price will continue current price trend. If the changes is decelerating, RSI predicts that price will reverse current price trend.
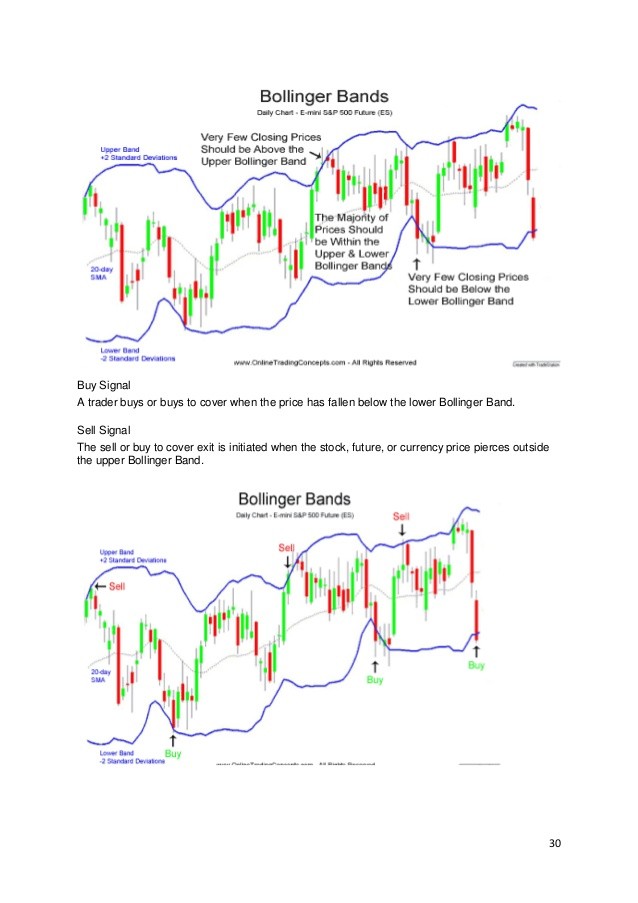
Bollinger Bands measure the momentum of price changes. Bollinger Bands calculate two bands to determine the high and low range of price action. The middle range of Bollinger Bands is used as basis to determine the upper and lower bands. Middle band is usually MA20, and the distance to upper/lower band is 2 times standard deviation from the middle band.
Bollinger Bands include the measurement of volatility into the band construction, thus the bands will expand and contract depending on the measured volatility in current price. This makes Bollinger Bands a unique indicators very useful for option traders.
When price break upper/lower bands, its very likely will reverse in the shorter timeframe. But like stochastics, during powerful trending market, the penetration of upper/lower bands dont predict that price will reverse.
Some option traders used fixed band indicator like Keltner Channel with Bollinger Bands to measure the likelihood of volatility increasing/decreasing in the future. When Bollinger Bands are outside Keltner Channels, its considered high volatility condition. When Bollinger Bands are inside Keltner Channels, its considered low volatility condition.


