The Forex Market Trend lines
Post on: 1 Май, 2015 No Comment

By forexnews on Jul 6, 2011 09:09:31 GMT
We are pleased to introduce the following series of articles that will discuss various aspects of the forex market, with the use of technical analysis (chart reading) and fundamental analysis (economic data). We will begin with simple concepts and move to more advanced areas of interest over time. Our goal is to apply these lessons to current market conditions so that we may anticipate future probable market conditions and the appropriate trades. We sincerely appreciate any comments / feedback, and we wish you the very best of luck in all your trading endeavors.
Adam Rosen.
The Forex Market Trend lines:
A ‘Trend’ occurs in the financial markets as an overwhelming number of buyers outnumber the sellers, or sellers outnumber buyers. These trends can be identified on a short and long-term basis, and those trends that occur in the forex market are typically the result of the underlying economic factors that exist in a given country. As economic conditions tend to change very slowly over great periods of time, those trends in the forex market also tend to be very long lasting. With that said, we should do our best to trade in the same direction of that trend, when one does exist. Simply put, “The trend is your friend”.
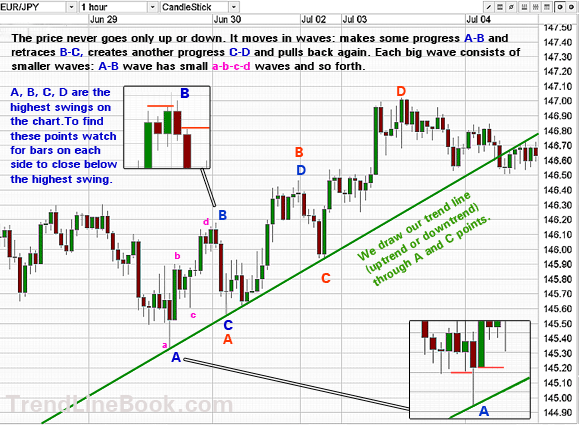
Trend lines are one of the most widely used indicators that identify the current market condition. If the market is moving to the upside, we may begin by drawing ‘Support’ by simply connecting at least 2-significant lows’. In a trend to the downside, we begin by drawing ‘Resistance’ by connecting at least 2-significant highs. Support and Resistance lines often times emerge in a parallel fashion, demonstrating the consistent historical behavior of buyers and sellers.
The preceding GBP/CHF (daily) chart shows a consistent trend to the downside. When a trend does exist, we should make every effort to trade only in the same direction as that underlying trend. Therefore, traders may look to ‘sell-short’ with the anticipation the market will continue to behave as it has so far, and continue lower. Ideally a position would be opened the next time the market tests and fails to break above its Resistance (upper trend line).
When the buyers and sellers exert a relatively even amount of influence a trend does not exist and the market tends to remain in a ‘Trading Range’. The following Gold (daily) chart demonstrates a typical ‘Range Bound’ condition, as the buyers and sellers have demonstrated a fairly equal amount of influence to the market. Support and Resistance lines are drawn in the same fashion connecting significant highs and lows. Here traders will use a simple ‘Buy low, sell high ’ approach with the anticipation the market will remain within this ‘consolidation pattern’.
These range bound markets are easily explained in the forex market, as the buyers (and sellers) tend to take equal positions in both currencies within the pair. For example, the CAD/JPY (daily chart) has formed a range bound pattern as those who take a position in the CAD match a relatively equal amount of traders that establish a position in the JPY. These range bound patterns often times take the form of ‘triangles’ as the Resistance line slopes lower, and Support moves higher.
Taking this a step further it is crucial to understand that ‘within every trend, there is a smaller range bound pattern and within every range, there is a smaller trend ’. Notice how the obvious range bound (triangle) pattern contains a (downward) trend that eventually reversed course to the upside creating yet another smaller trend. Since a trading range or trend can be identified on virtually any chart, it is important that we maintain a consistent approach when studying the markets, such as the ‘daily’ charts discussed here.
In another example the USD/CHF has continued to trend lower for a number of years now, enticing traders to sell-short with the anticipation of lower lows in the days and months to come. In particular, notice how this solid trend to the downside is actually made up of many smaller range-bound patterns. A trader with a very long-term outlook may choose to simply take a ‘short’ position near resistance and hold on to this trade for weeks, months, or perhaps several years. On the other hand, those with a shorter-term time horizon may choose to ‘trade the range’ employing a ‘buy low, sell high’ strategy within these smaller range bound patterns.
A third more advanced option is also at our disposal; Given the fact that the market has demonstrated an overwhelming tendency to move lower, we may choose to only look for trades to sell-short even within a range bound pattern. This multi-year (down) trend is actually comprised of 6-range patterns, all of which eventually ‘broke’ to the downside. For those individuals who only look for ‘short’ trades, have a higher probability of success by honoring the longer-term dominant trend, even when searching for short-term trades .
In short, using Support / Resistance trend lines can serve us in a number of ways. They help identify the market condition, (trend or range-bound), and the direction of any trend that may currently exist. But moreover trend lines also aid us in identifying the approximate price where a position should be taken, where protective stop orders should be placed, and what profits we may expect in the future. Implement trend lines into your own trading arsenal, as they will serve you well.


