Ichimoku Kinko Hyo Chart Manual
Post on: 16 Март, 2015 No Comment

9.4 Ichimoku Kinko Hyo
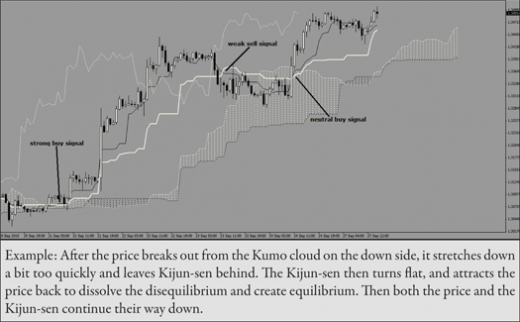
Ichimoku kinko hyo by journalist Goichi Hosoda (writing under the pseudonym Ichimoku Sanjin the 1930s) is a set of indicator lines designed to show the overall state of the market. The name in Japanese means roughly chart equilibrium at a glance. Tenkan (orange) and Kijun (red) The tenkan line shown in orange is the midpoint of the past 9-day trading range, and the kijun line shown in red is a similar midpoint but of a slower 26 day period. A crossing of the tenkan up through the kijun is taken as a bullish signal, or conversely a downwards crossing is bearish. This is similar to fast/slow moving average crossing systems, but using range midpoints.
Senkou cloud (green) A senkou or cloud region is shown between green lines. One line is the average (the mean) of the tenkan and kijun, the other is the midpoint of the 52 day trading range. But these lines are drawn 26-days ahead, and thus extend out past the end of the latest data. The idea is that the present values of those are predicted to have a future influence.
The cloud adds to the bullishness or bearishness of the tenkan/kijun crossovers. A bullish cross while above the cloud is a strong buy signal, whereas within the cloud it’s only a normal buy, or below the cloud a weak buy. Conversely a bearish cross is a strong sell if below the cloud, normal within, or weak if above. The cloud region beyond current data is also interpreted as prospective future support/resistance.
Chikou (blue) The chikou line drawn in blue is closing prices shifted back 26 days. It’s interpreted relative to those past prices, with chikou above being bullish or below being bearish. This is similar to the kind of comparison momentum makes (see Momentum and Rate of Change ).
The time periods of 9 days and 26 days are parameters in Chart (see View Style ). When Hosoda designed the system Japanese markets traded 6 days a week, so 9 days was 1 1/2 trading weeks and 26 days was a month. The same calendar times in today’s 5 day weeks can be had with 7 and 22 days.
9.4.1 Range Midpoint
An N-day range midpoint like the tenkan, kijun and cloud lines is also available separately as Range Midpoint if you want to experiment. It’s under Low Priority in the averages list.
Chart is free software; you can redistribute it and/or modify it under the terms of the GNU General Public License as published by the Free Software Foundation; either version 3, or (at your option) any later version.


