How to Trade Using Kagi Charts
Post on: 1 Апрель, 2015 No Comment

New Traders very often find the task of working out the short term price action of a particular currency pair quite intimidating. This can be doubly so when looking at forex charts and trying to decide which technical analysis tool is going to give them some insight into the future price action. The prices which just seem to be arbitrary, volatile and moving illogically make predicting the direction of the currency very difficult and seemingly impossible. This is because much short term price movement is just market noise which has no bearing on the important price moves of a currency. However, there are some charting techniques which filter out market noise and help a Trader focus on the significant price action. One of these charting techniques is Kagi charts.
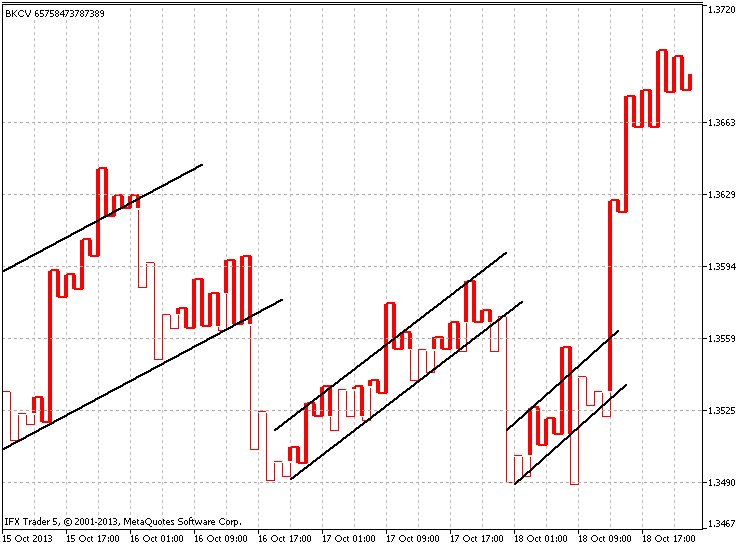
A Kagi chart is very unlike the traditional candlestick or line chart which depends on time; the Kagi chart is time independent and consists of a sequence of vertical lines that depend on the price action rather than time.
As you can observe from the chart above a Kagi chart consists of several vertical and horizontal lines and the vertical lines vary in thickness contingent on the price of the asset. In some cases the lines are thin; in others the lines are thick and yet in others the lines are bolded. This variance in thickness of lines is the most important feature of a Kagi chart.
The price action of the currency determines the thickness of the lines. The thick line is the Yang line and the thin line the Yin line. The places where the line changes from moving up to moving down is called the ‘shoulder’; the places where the line changes from moving down to moving up is called the ‘waist’. A Yin that moves above the prior shoulder becomes a Yang line. Conversely, when a Yang line moves below a prior ‘waist’, it turns into a Yin line.
Unless prices reverse by a prior quantified amount the Kagi line will carry on moving up (prices rise) or down (prices fall). If the price reversal is the specified amount a horizontal line is added and also a new vertical line which ranges to the new price closing. There are a number of ways to state the reversal amount, however the most common and easiest way is to use a percentage amount. Most Traders use 4 percent as the specified amount.
Trading and interpreting the Kagi chart is encapsulated in the expression ‘buy on Yang and Sell on Yin’. When a price exceeds a previous high the Kagi line goes from thin to bold thick and indicates a buy signal. Similarly, when a price falls below the previous low the Kagi line goes from thick to thin and indicates a sell signal .


