Forex Candlesticks Candlestick Patterns
Post on: 24 Сентябрь, 2015 No Comment

Candlestick Patterns
Candlestick Basics
I’m not going to give you the whole history of candlesticks, where they originated from, etc. If you’re interested in the history, just search the web and you’ll find more than enough information about them. This section is intended to teach you what candlesticks and candlestick patterns are, what they look like and how to read them and if you want to know how to trade these pattens for incredible profits, check out Chris Lee’s Forex Candlestiicks Made Easy. It’s one of the best ways I know how to make money in any market conditions.
A candlestick describes the open, high, low and close price of the trading period in a single candle. If you’re looking at a 15 minute chart, then each candle represents a 15 minute timeframe. An hourly candle, represents price movement in one hour. You get the picture.
A long body has a very long body when compared with other recent candles.
A short body candle usually implies consolidation, as the forex market traded in a narrow range during the trading period.
The body of the candle indicates where price “opened ” for that timeframe and where price “closed ”. The “wicks ” at the top and bottom of the candles, indicate the “high” and “low” price for that period.
Note: Candles can be any color you choose but we will be using green candles to indicate upward price movement (bullish) and red candles to indicate downward price movement (bearish).
Green bodies show increased buying pressure and red bodies show increased selling pressure.
All candlesticks and patterns indicate where price should move in the future. This is not an exact science, however these patterns play out more often than not and that’s why they are very powerful tools to use with your trading. The key is to recognize these patterns and know when to trade them and when “not” to trade them.
Reversal candlestick patterns
Engulfing Patterns
When the candle body engulfs the previous candles body, this is called an “engulfing” pattern. Green engulfing candles are considered bullish engulfing patterns and red engulfing candles are considered bearish engulfing patterns. Bullish engulfing patterns are usually found at price bottoms and bearish engulfing patterns are found at price tops. Candlesticks such as dojis, hammers, hanging mans need trend confirmation before engulfing patterns should be used.
Evening Star Patterns
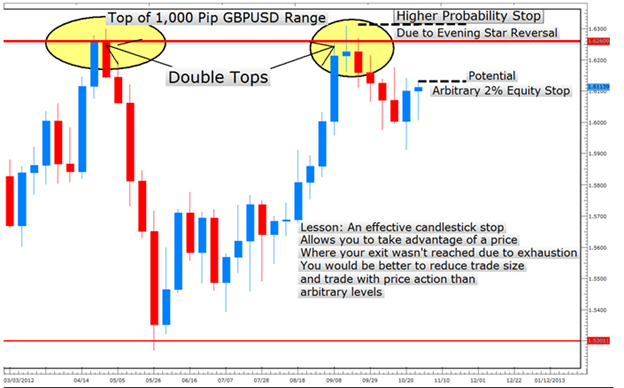
In an uptrend, the market builds strength on a long green candle and the next candle the market trades within a very small range and closes at or near its opening price. This can be a doji, spinning top or hammer candle. This usually means the existing trend is coming to an end. The 3rd candle in this pattern is used for confirmation of the trend reversal. If this is a red candle closing down in price, then this completes the pattern.
Note: The star candle can have a very small body but the “wicks ” should be more noticeable than the actual body of the candle.
There are also “Evening Star Doji Patterns ” and the only difference is the moring star candle is a doji instead of a small body candle:
Morning Star Patterns
In a downtrend, the market loses strength on a long red candle and the next candle the market trades within a very small range and closes at or near its opening price. This can be a doji, spinning top or hammer candle. This usually means the existing trend is coming to an end. The 3rd candle in this pattern is used for confirmation of the trend reversal. If this is a green candle closing up in price, then this completes this pattern.
Note: The star candle can have a very small body but the “wicks ” should be more noticeable than the actual body of the candle.
There are also “Morning Star Doji Patterns ” and the only difference is the morning star candle is a doji instead of a small body candle:
Single Candle Patterns

A single candle pattern can be Doji’s, such as Dragonfly Dojis, Gravestones, etc, Hammers/Hanging Man, Shooting Stars and others.
Doji patterns
Dojis are primarily reversal candlesticks. They usually means indecision in the market and in most cases indicate a reversal, but remember a doji by itself doesn’t mean anything. It’s the surrounding candles (e.g evening stars, morning stars, etc) that determine what the doji means. There are a few different Doji types:
Spinning Tops
These patterns have longer shadows than the real bodies. The colors of the real bodies are not important. The patterns indicate the indecision between the bulls and the bears:
Hammers and Hanging Man Patterns
Hammers and Haning Man candles are short body candles with little or no upper shadow, and a lower shadow at lease twice as long as the candle body. Hammers are formed after price declines, and hanging man’s after price advances. When confirmed they become powerful reversal signals. The color of the hanging man/hammer is not important but some consider green hammers and red hanging man’s stronger reversal signals.
Shooting Star
A shooting star has long upper shadow (wick ) and a small real body at the lower end of the price range.
The Forex Candles and Candlestick patterns on this page are considered to be the most dependable patterns for finding high probability trade setups. There are more patterns such as The Three Black Crows, The Three White Soldiers, Rain Drops and many others. As long as you familiarize yourself with the candlesticks and patterns above, and use them when they present themselves, you will do very well technical trading the forex market.


