Candlestick formations in Binaries Trading
Post on: 23 Сентябрь, 2015 No Comment

The Candlestick chart is widely used graph type and it is successfully employed to reveal certain patterns, which can determine the upcoming market trend. Actually for short term trades, exactly like the binaries trading, candlestick could give you a great entry signals.
Unlike Forex and CFD trading, where the profit is measured from the tick size, in Binary the only thing that matters is whether the end price will be above or below the entry rate. In other words when it comes to Binary options, the right entry is crucial and better understanding the graph is essential. The option expiry time will depend on the chart time frame.
For example if you spot figure on 5 minute time frame, you must buy Call/Put option that will expire after 10 minutes or more and if you spot the pattern in higher time frame you need buy Call/Put option set on a distant time frame and give time for the prediction to develop.
Here are some of the most common candlestick formations that can be used to spot a reversal or continuing movement.
1. Dark Cloud Cover A Bearish Reversal Signal (Down/Put signal)
In an uptrend a long bullish candlesticks followed by a bearish candlestick that opens above the prior white candlesticks high. It then closes inside the white candlesticks real body.
2. Doji – trend reversal or continuing movement (Put or Call signal)
A session in which the open and close are the same. There are different varieties of doji patterns (such as a gravestone or long-legged doji) depending on where the opening and closing are in relation to the entire range. Doji formations are among the most important individual candlestick lines and they can be used as a signals for trend reversals. A doji after uptrend, will mean downtrend reversal and doji after downtrend will mean uptrend movement.

3. Engulfing formations – trend reversal (Put or Call signal)
There is a bullish and bearish engulfing pattern. A bullish engulfing pattern contain large bull candle which engulfs a small bear candle in a downtrend. The bullish engulfing pattern is an important signal for reversal. A bearish engulfing pattern, occurs when selling pressure break buying pressure as reflected by a long bear candle engulfing a small bull candle in an uptrend.
4. Hanging man – trend reversal (Call or Put signal)
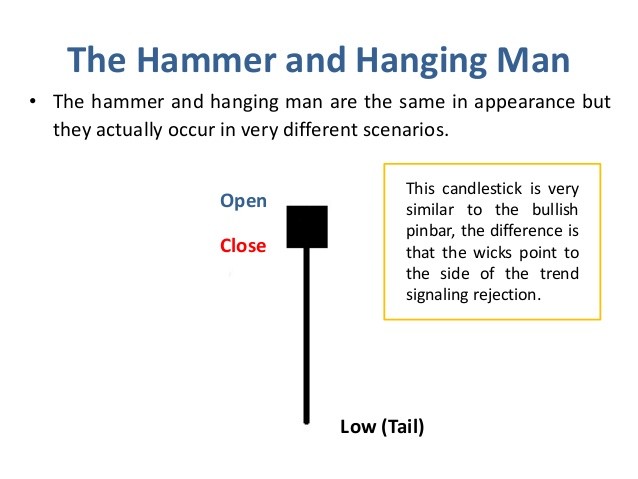
The hanging man and the hammer are both similar candlestick formations (i.e. a small real body (bear or bull), with little or no upper shadow, at the top of the sessions range and a very long lower shadow). But when this line appears during an uptrend, it becomes a bearish hanging man. It signals the market has become vulnerable, but there should be bearish confirmation the next session (i.e. a bull candlestick session with a lower close or a weaker opening) to signal a top. In principle, the hanging mans lower shadow should be two or three times the height of the real body.


