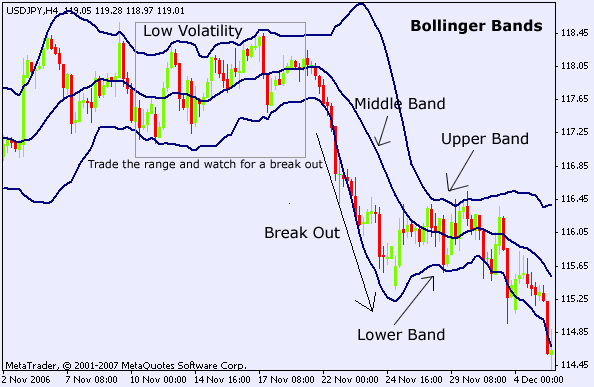
Bollinger Bands in Forex Trading
Post on: 1 Август, 2015 No Comment

9.1. What are Bollinger Bands?
Bollinger bands are lines traditionally placed at 2 standard deviations above and below the 20-period simple moving average — far enough to keep 95% of currency price action between them. Because of the way they are constructed, bollinger bands expand or contract in response to changes in price volatility. when volatility increases the bands expand, when it decreases they contract. The wider the bands are apart — the higher the volatility and the closer they are to each other — the less volatile the prices. The bands tend to alternate between the states of contraction (also called squeeze) and expansion, signalling transitions from quiet to active markets and vice versa. The closer the bands come together and the longer they stay close to each other the more likely it is that the prices will move sharply in the near future (which can be triggered by a break of some support or resistance level ).
Daily EUR/AUD chart shows how Bollinger bands react to sharp currency price moves.
Click to Enlarge.
Daily CHF/JPY chart demonstrates how Bollinger bands widen and tighten depending on the currency price action.
Click to Enlarge.
Quote: Perhaps one of the most interesting aspects of Bollinger Bands is the rhythmic contraction and expansion of the bands you can see on the charts., John Bollinger, in his book Bollinger on Bollinger Bands .
Note: Bollinger bands are most commonly used with the daily charts.All of the forex charting packages make it possible to plot the Bollinger bands. Some of these packages (e.g. Intellicharts) also include the Bollinger Band Width indicator which clearly shows the distance between the two bands. You can use this indicator to stay alert to those situations when volatility drops to historically unsustainable levels and by doing so heightens the chances of a strong price move occurring in the near future.
9.2. Using Bollinger Bands in Forex Trading.
Bollinger bands are most useful when they are touched or penetrated by the prices. The bands are always adjusted to the volatility of the recent price action; therefore, when they come in contact with the prices this usually reflects significant changes in underlying price dynamics. If the prices thrust outside of a very narrow Bollinger band this is often viewed as a strong breakout signal. When the prices repeatedly close outside a Bollinger band this can be a powerful continuation signal in the trending markets. A long reversal candlestick pattern shooting through a bollinger band in a trending market can sometimes be a sign of impending trend reversal. As a general rule, the prices are considered overbought when they touch the upper band and oversold when they hit the lower band. The following example demonstrates how often a contact with the Bollinger Bands can lead to a price reversal.
Click to Enlarge.
You can combine Bollinger bands with the other technical analysis tools to confirm or refute their trading signals. Bollinger bands can help to clarify various reversal price patterns — often, inability of the prices to penetrate a band on a second test (e.g. for double tops or bottoms ) or a third test (e.g. for head and shoulders pattern, as is shown on the daily EUR/NZD chart below) confirms the validity of the pattern.
Click to Enlarge.
As an example of a more complex pattern combination, a reversal candlestick piercing a Bollinger band on a RSI divergence can be a high probability reversal setup as you can see on the daily GBP/JPY chart below.
Click to Enlarge.


