How to calculate portfolio returns
Post on: 18 Сентябрь, 2015 No Comment

Want to know if youve beaten the market? Put your stock picking to the test with these spreadsheet performance calculators.
No one wants to be average. Everyone wants to know whether theyve beaten the market or not? Its just that when you set about trying to establish your portfolio returns, you enter a black hole from which the only thing to emerge is a blistered finger and a promise never, ever to get sucked into this void again.
This Investors College. with the help of three downloadable spreadsheets in which you can enter your own data, is going to change all that. Finally, with just a bit more application, youll be able to see whether youve outperformed the index or not. Yes, were going to fill the black hole. All you have to do is bang in the numbers.
Key Points
- Measure your portfolios performance regularly
- How you do so will depend on your own requirements
- Use our three simple calculators to assist you
Calculator 1: A simple portfolio
This first calculator is designed for simple portfolios, in which an initial lump sum is invested and all dividends reinvestedjust like our model Growth portfolio.
It works by figuring out how much the value of the portfolio has changed, how much time has elapsed, and then calculates the compound annual growth rate accordingly. Its currently set up to calculate the return of our Growth portfolio to 30 Jun 11, but by clicking the Click to Edit button then editing the yellow cells you can calculate your own performance.
The cells to the right calculate the indexs return over the same period. It works by looking up the value of the All Ordinaries on the portfolios start date (the data is hidden in Sheet 2), and comparing it with the current value. Youll need to establish the current value for yourself as the spreadsheet can only use historical figuresyoull find current and historical prices at Yahoo Finance .
Note that weve added 4.3% to the indexs returnroughly the average historical dividend yieldbecause most indices dont include dividends (accumulation indices do, but this data doesnt come cheap). No matter which spreadsheet you use, stick with Calculator 1 to find the comparable index return. If money has never entered or left your portfolio since you started it, this calculator is all you need.
Calculator 2: A shortcut
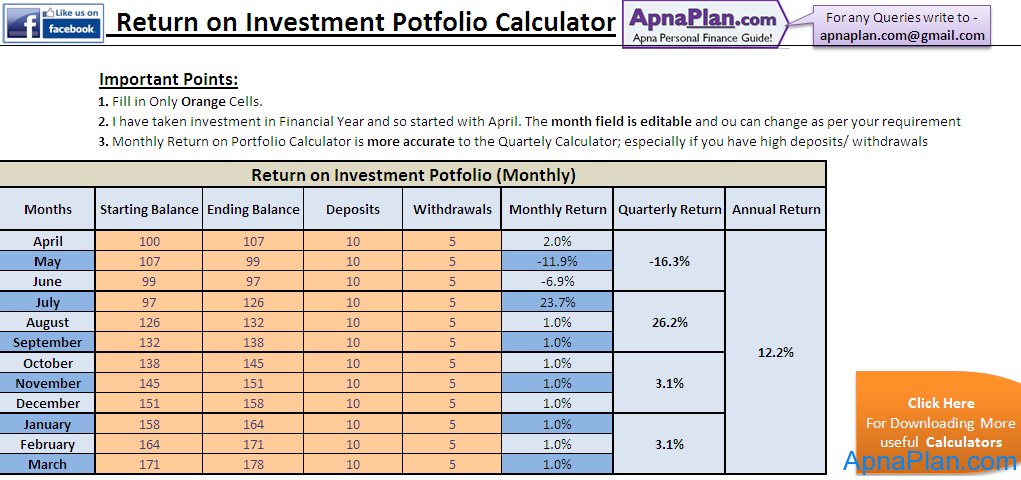
This calculator allows you to calculate your returns when youve added or removed money from your portfolio since inception.
Want to know more?
These spreadsheets can turn very short term performance returns into annualised rates. We dont recommend this; a portfolio which rose 3% in a month is not comparable to a portfolio which grew 40% in a year. Stick to periods of a year or more.
Now, were not talking about when you buy stocks with dedicated investment cash, or sell stocks and hold cash instead. Were talking about situations when, for example, you added saved-up wages to your investment portfolio, or spent dividends buying groceries or paying bills.
Thats exactly what we assume dividends are used for in our Income portfolio, and weve set up Calculator 2 to find its performance.
Basically, the formula calculates the dollar amount by which your money has grown, and divides this by the average amount of capital that was invested; the initial investment plus half of the net deposits (deposits less withdrawals). Total and compound annual returns can then be found.
This spreadsheet allows more flexibility but has an important drawback; it doesnt know when you withdrew or deposited that cash. It guesses; a shortcut that means the resulting number is only approximate. This is why the Income portfolios calculated return of 16% is overstated by a couple of percent (see Calculator 3).
If youre calculating performance over less than perhaps five years and havent moved lots of money around, youll get a rough answer (to within probably a percent or two) without much hassle. But if you need greater accuracy, our third calculator is for you.
Calculator 3: The internal rate of return
Calculator 3 uses the internal rate of return (IRR). Technically, the IRR is the discount rate at which the net present value of a series of cash flows is equal to zero. In English, its the compound average annual return, taking into consideration when cash is deposited or withdrawn. Its the most accurate way to calculate your performance, and weve shown how to use it with our Income portfolio.
To use this calculator, you need to enter every deposit into your portfolio as a negative cashflow and every withdrawal as a positive one, along with their corresponding dates. The portfolios ending balance is also entered as a positive cashflow.
In the case of the Income portfolio, the ($100,000) in July 2001 relates to the initial investmenta deposit. The positive cashflows every six months thereafter relate to dividends received over those periods. As these dividends are assumed to be spent, theyre withdrawals.
The last cashflow, on 30 June 2011, is equal to dividends of $5,240 from the prior six months, plus the total portfolio value comprising $152,365 of stocks and $17,217 of investable cash. This is exactly the way we calculated the Income portfolios 13.6% return for our six-monthly portfolio update (see Income portfolio weathers the storm ).
Want to know more?
For those with complex affairs or requiring the most accurate reporting, you might want to consider using portfolio management software. None of our analysts use it personally, but this Bristlemouth blog post gives a good overview of whats available.


