How to Calculate Compound Annual Growth Rate in Excel
Post on: 1 Июнь, 2015 No Comment

This tutorial will teach you how to calculate the compound annual growth rate, or CAGR, in Excel. Youll also learn about some of the limitations.
Different investments go up or down in value by different amounts over different time periods. Investors need a method of comparing one investment against another, especially if the returns have been volatile, or if investments and withdrawals are at irregular dates.
CAGR is the annual return of an investment assuming it has grown at the same rate every year. Its a common concept; for example, the one, three and five-year returns on mutual fund fact sheets are CAGR values.
One method of calculating CAGR is given by this equation.
There are three parameters in this equation.
- start value of the investment
- end value of the investment
- number of years between the start and end value
You can also manipulate this formula to give, for example, the number of years required to grow an initial investment from a start value to an end value, given the growth rate.
This Excel spreadsheet uses the formulas above to calculate CAGR.
The spreadsheet also rearranges the formula so you can calculate the final amount (given the initial amount, CAGR, and number of years) and the number of years (given the initial and final amount, and CAGR).
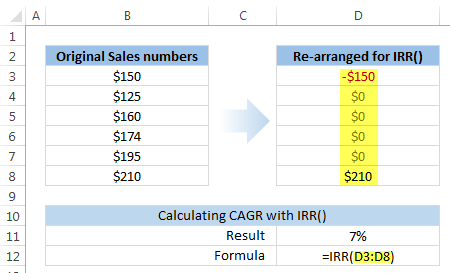
You can also calculate the Compound Annual Growth Rate using Excels XIRR function check out the screengrab below for an example. XIRR takes three arguments.
- The first is a range of cash flows into or out of the investment. Invested amounts are positive, but withdrawals are negative.
- The second is a range of dates corresponding to the investments or withdrawals,
- The third is a guess value for the CAGR (XIRR uses Newton-Raphson iteration, so it needs a guess value tostart the iteration).
XIRR is flexible, and can also given you the CAGR given investments and withdrawals at irregular dates. As an example, examine the screengrab of the Excel spreadsheet.
Limitations of CAGR
CAGR has several limitations that investors need to be aware of.
- CAGR hides volatility by assuming that investments grow at a constant rate. Volatility is an important factor in managing investment risk and cant be ignored.
- Its based on historical data, and cant be relied on as the only method of predicting future value.
- CAGR can be manipulated by picking the time period over which it is measured. An unscrupulous fund manager can, for example, choose a start date with an unusually low investment value.
This Excel spreadsheet contains the examples demonstrated in this article. Youll need to enable the Analysis Toolpack to use the XIRR function.


