Election Forecasting Monte Carlo Electoral Vote Simulation
Post on: 30 Июнь, 2015 No Comment

Election Forecasting Methodology
This overview contains a brief discussion of the following :
. Time-series regression models vs. Monte Carlo polling simulation
. Final 2004 state and national projections confirmed by the exit polls
. Analysis of 2004 registered voter (RV) and likely voter ( LV ) polls
. Final state and national pre-election polls and projections vs. the exit polls
. Real Clear Politics (RCP) 102 RV and 31 LV poll trend and analysis
The 2008 Election Model is updated frequently for the latest state and national polls.
There are two basic methods used to forecast presidential elections:
1) Projections based on state and national polls
2) Time-series regression models.
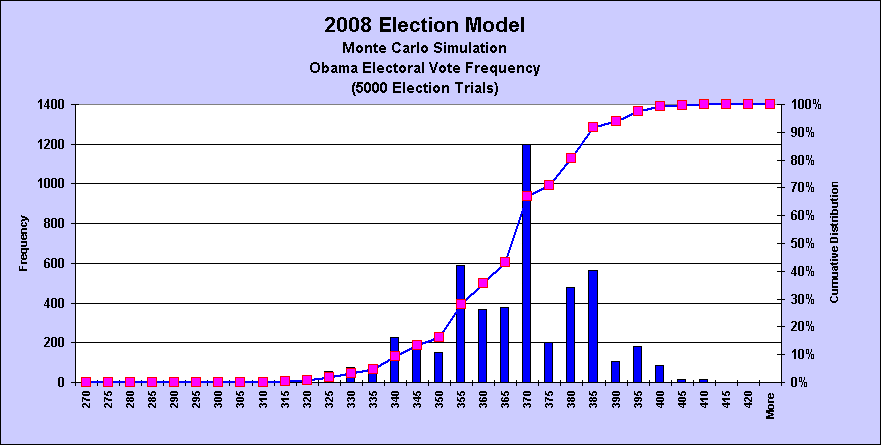
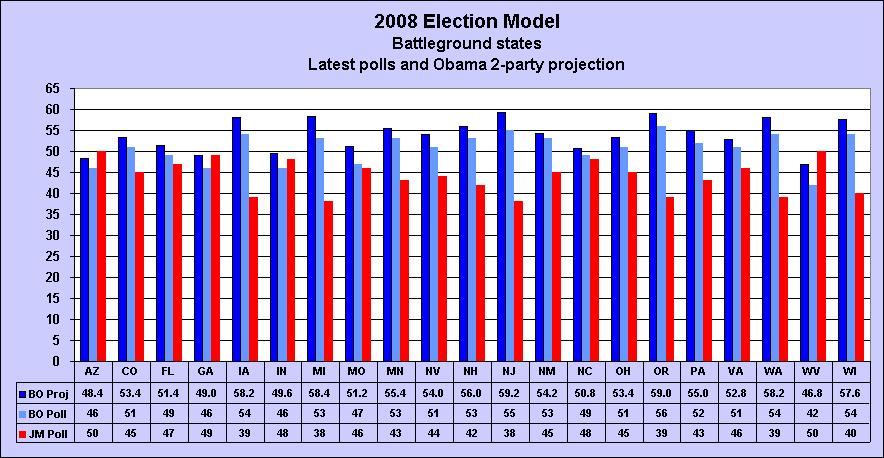
Statistical polling (state and national) is an indicator of current voter preference. In the Election Model, state poll shares are adjusted for undecided voters and the associated win probabilities are then input to a 5000 election trial Monte Carlo simulation. The goal is to calculate the expected electoral vote shares and the probability of an electoral vote victory. The probability is simply the number of winning election trials divided by 5000. The projection is not a long-term forecast; it assumes the election is held on the day of the projection.
Intuitively, the probability of winning the True (no fraud) popular vote should correlate to the Monte Carlo simulation probability of winning the electoral vote. In fact, if both probabilities are within a percentage point of each other, we can have confidence that they are correct mathematically. Probabilities generated by academics are inconsistent with forecast vote shares (see below) and do not check them against the probability of winning the electoral vote.
The Election Monte Carlo simulation uses individual state vote projections to determine the probability of winning the state. The probability is calculated for all 50 states and 5000 simulated election trials are executed to determine the average electoral vote split and the number of winning trials for each candidate. The probability of winning the electoral vote is just the number of winning trials divided by 5000.
The probability of winning the popular vote is based on the projected aggregate state 2-party vote share and margin of error. These are input to the Excel normal distribution function NORMDIST: Prob (popular vote win) = NORMDIST (vote share, 0.50, MoE/1.96, True)
As of July 1, the Election Model has produced an identical 99.2% probability that Obama would win the popular and electoral vote if the election was held on that day. His projected 53.2% popular vote and 2% MoE are input to NORMDIST (.532. 50. 02/1.96, true), which returns the 99.92% probability.
Obama won 4996 (99.2%) of 5000 Monte Carlo simulated election trials. Coincidentally, the probabilities match to within .01%!
Academics and political scientists create multiple regression models to forecast election vote shares months in advance. The models utilize time-series data as relevant input variables such as economic growth, inflation, job growth, interest rates, foreign policy, historical elections, incumbency, approval rating, etc. Regression modeling is an interesting theoretical exercise which does not account for the daily events which affect voter psychology.

Polling and regression models are analogous to the current market value of a stock and its intrinsic (theoretical) value. The intrinsic value is based on forecast annual cash flows and rarely is equal to market value. The latest poll is to the current stock price as the regression model vote share is to intrinsic value.
Inherent problems exist in election models, the most important of which is never discussed: Election forecasts and media pundits never account for the probability of fraud. The implicit assumption is that the official recorded vote will accurately reflect the True Vote; the election will be fraud-free.
The following 2004 election forecasting models were executed 2-9 months before the election.
The average Bush 53.9% 2-party projection deviated sharply from the aggregate unadjusted state exit poll (47.7%).
None of the models forecast the electoral vote or mentioned the possibility of election fraud.
Except for Beck/ Tien. the popular vote win probabilities were incompatible with forecasted vote share.
Assuming a 3.0% margin of error, a 53% vote share implies a 97.5% popular vote win probability.
A 54% vote share implies a 99.99% probability.
Final state and national polls, adjusted for undecided voters and estimated turnout, are superior to time-series models executed months in advance.


