Common Size Analysis – A Different Way to Analyze the Balance Sheet and Other Financial Statements
Post on: 18 Август, 2015 No Comment

by Begin To Invest on May 24, 2014
Common Size Analysis of Financial Statements involves looking at numbers only as a percentage of a specific total.
This is helpful when not only looking at a single company’s balance sheet, but also comparing multiple business of different sizes at one time.
So instead of comparing balance sheets of multiple businesses like this:
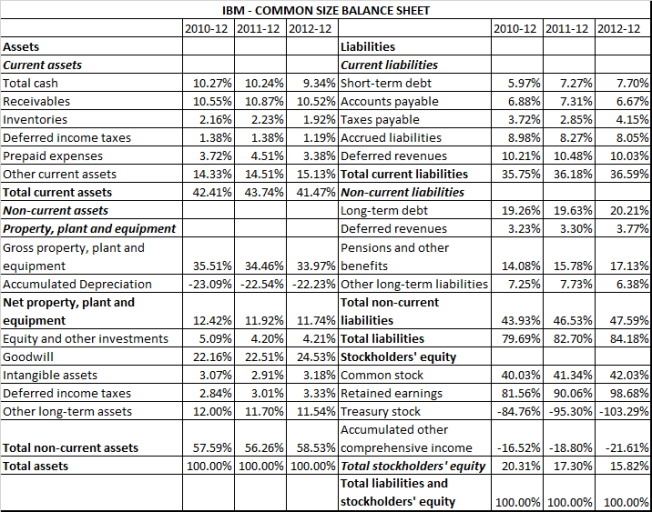
A typical common size balance sheet would look like this:
In this first image, it is obvious to see that company C is much larger (by way of total assets. But how does company C’s $3 million in cash compare to a smaller company, such as company A, with $1 million in cash?
This is just one example of where common size analysis of financial statements can help investors see differences in companies’ capital structures, strategies and financial standing.
It turns out, Company A’s $1 million is just about identical to Company C’s $3 million when looked at as a percentage to total assets.
What else could this information above tell us about Companies A, B and C?
Company B’s low cash balance may be a cause for alarm, certainly considering its total current liabilities. Company B also has a very high level of accounts receivable and inventory. Is the company having difficulty collecting money from customers? Difficulty selling its product? These numbers would warrant a much closer inspection of Company B’s business.
Company C has spent much more money on Property, Plant and Equipment (which make up 47% of its total assets). This may be showing an investment to manufacture materials in-house, or own equipment, buildings, etc. instead of leasing.
Let’s use this idea of common size financial statement analysis in a real life example.
Common Size Balance Sheet Analysis
(For our general guide at analyzing a company’s balance sheet – see our guide here: Guide to Reading a Balance Sheet )
Consider Intel’s (Ticker: INTC) balance sheet:
Intel has divided all numbers above by 1 million to make the numbers easier to read. When importing these numbers into a spreadsheet for more in depth analysis, I like to get those million back into the numbers for consistency down the line. Also, you need several years’ worth of data for comparison. Now the balance sheet looks something like this:
Now it starts to get a little confusing. But analysis of a company’s financial statements should consist of looking at much more than just a couple years.
Let’s say I want to see how Intel’s balance sheet has changed over longer periods of time, so I bring in even more data:
Depending on what I am looking for, this is when the numbers start to be a little overwhelming. Especially if I then want to compare this 6 years’ worth of data to another company or the industry average. How could I easily compare some of Intel’s numbers, typically in the tens of billions of dollars, to a much smaller company who may only make tens of millions of dollars per year? Or asses how Intel’s liquidity compares to the rest of the industry? Or asses how much Intel is spending on things like research and development compared to smaller companies in the rest of the industry?
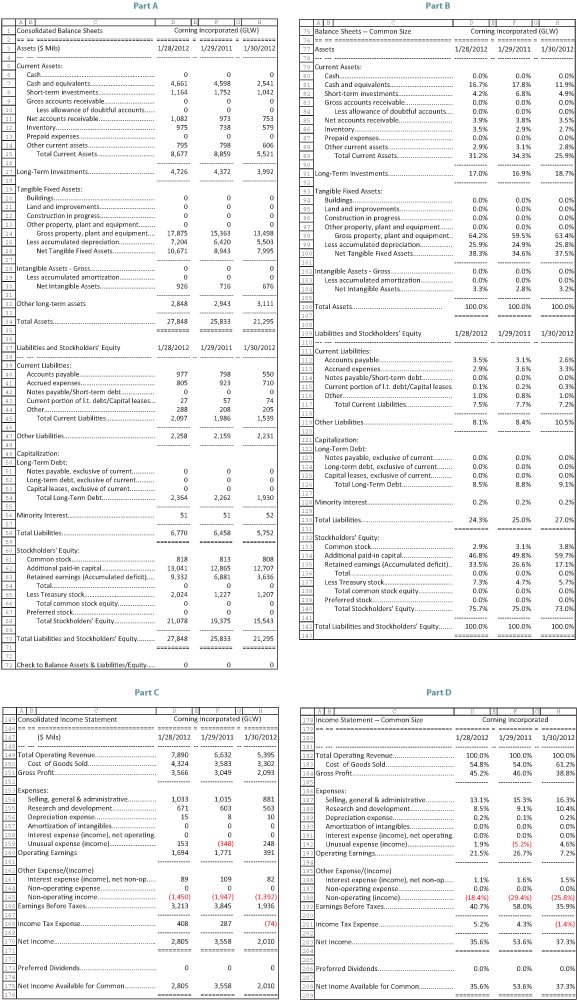
One way is to convert all this into a common size balance sheet (or income statement – more on that below) for easier analysis.
Simply insert columns, set up some division, and let excel work its magic:
(click to enlarge)
Now we have a perfect set up to see how Intel’s balance sheet has been changing over time.
This data can be put into a graph to make the data even clearer:

This chart below shows the common size balance sheet of Intel’s total assets. Notice the Y-axis is in percent, not dollars.
(click to enlarge)
For me, this graph is 1000x easier to read than columns and columns of numbers in the billions. Over time we are seeing Intel invest more into property, plant and equipment (looking at the income statement supports this as well – more on that below), becoming slightly less liquid and rely more heavily on acquisitions (as evidenced by the increase in Goodwill).
Notice we are just looking at assets, this type of balance sheet analysis can be used to check out the company’s liabilities as well. What percent of Intel’s liabilities is short term debt? What percent of Intel’s liabilities are long term borrowings? All this can be answered very simply by common size balance sheet analysis.
Common Size Income Statement Analysis
This type of analysis of financial statements can be used on more than just the balance sheet. For example, the last 6 years of Intel’s income statement could also be used:
(click to enlarge)
In this chart above we are looking at how items on Intel’s Income Statement compare as a percentage of the company’s net revenue.
We have seen gross margins rise, cost of sales remain relatively steady and amounts invested into research and development rise for Intel over the past few years.
Conclusion
You can get incredibly specific with this type of analysis, or use it to quickly analyze a company from a much broader view. Feel free to get creative in setting up your analysis. You could break up income by certain operating segments of the company (Operating income, income from selling off assets, income from trading securities, etc), or in combination with Return on Assets (ROA) or Return on Equity (ROE) to determine the assets that are increasing fastest (Are income producing tangible assets increasing? Or intangible assets that may be susceptible to management playing games with the balance sheet)? Or use the Statement of Cash Flow and break down the company’s use of cash.
This type of analysis allows investors to see the company’s financial statements in a different light. We used Intel in the examples for this article, but this type of analysis would be very good for looking at much faster growing companies where balance sheets are changing much more dramatically.
Like any type of analysis, this is hardly an “end all, be all” analysis. But it may help narrow where to focus in a company’s recent 10-q or 10-k statements for clarification. The charts above show Intel’s cash balance dropping and goodwill increasing, but it does not tell you the reason. Is the company using cash for acquisitions? Or is the company just failing to write down the value of its goodwill and just not generating enough cash from its operations? Further insight is required, but this analysis has clearly shown the changes in the company’s financial condition and should point you where to research further.


