Average directional index (ADX) indicator
Post on: 16 Март, 2015 No Comment

The Average Directional Index, or the ADX indicator for short, acts as a guide to confirm the signals produced by other technical indicators. The Average Directional Index is an indicator that measures the strength of a trend. For example, it can measure whether an uptrend or downtrend is gaining momentum or slowing down.
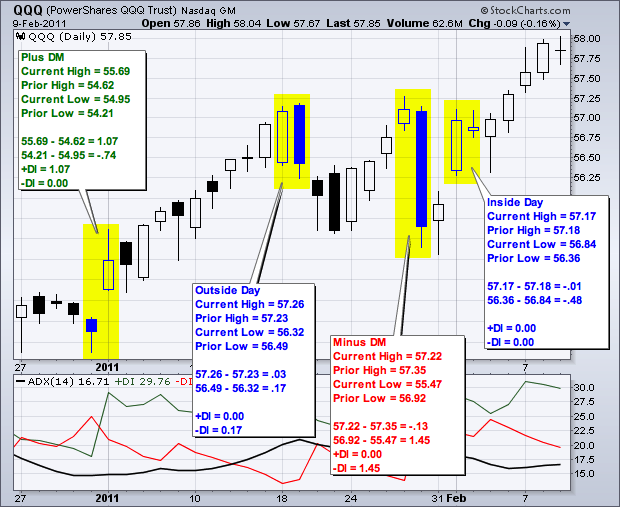
The Average Directional Index (ADX) indicator is a combination of the positive directional indicator (+DI) and the negative directional indicator (-DI). The +DI tracks the upward trend of the stock, while the -DI tracks the downward trend. The ADX indicator combines the two and produces a unified trend strength indicator.
The ADX indicator is an oscillating indicator, ranging from 0 to 100, with 0 indicating flat trading, and 100 indicating either a skyrocketing or plunging stock. The ADX only indicates the strength of the trend, and does not indicate its direction.
However, it is unlikely to see ADX indicator values above 60, since such high values indicate a trend that usually only appears in long bull runs or long recessions. Usually, any ADX value above 40 is considered to be a strong trend, while any ADX value below 20 indicates that the stock is in a trading range.
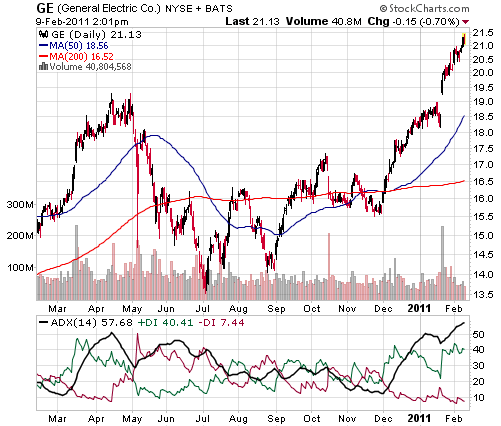
In the chart below, the +DI is depicted as a thin green line, and the -DI is depicted as a thin red line. The ADX indicator is the thick black line.
From the chart, the ADX indicates that from late February to mid April, the stock was in a strong trend, in this case an upward trend. For this stock, the ADX indicator did not go below 20, which indicates that there wasn’t a period where the stock was trading flat. This is quite accurate, since it can be seen from the stock price that the first 3 months was an uptrend and the last 3 months was a downtrend.
The Average Directional Index (ADX) indicator depicts the strength of a trend. and does not differentiate between an uptrend or a downtrend. ADX indicator values above 40 indicate a strong trend. while ADX values below 20 indicate a sideways trading range .
As for signals produced by the Average Directional Index (ADX) indicator, a move below 40 from above indicates that the trend is slowing. Since most option strategies rely on large price movements in short timeframes, a slowing trend is bad. Therefore an ADX move below 40 would indicate that it is time to close our positions.

Conversely, an ADX indicator move above 20 from below indicates that the sideways trading is over, and a new trend is developing. This would indicate that it is time to make a move, either bullish or bearish.
In the chart above, the ADX indicator produced a signal in mid April indicating that the trend (in this case upwards) is fading. In early July, the ADX indicator briefly touched 20 from above and immediately turned back up. This indicates that momentum is picking up and a new trend (in this case downwards) is forming.
Also, signals can be obtained by looking at where the positive directional index +DI (green) and negative directional index -DI (red) lines cross each other. When the +DI crosses above the -DI from below, it is a bullish signal, such as in early February. When the -DI crosses above the +DI from below, it is bearish, such as in late April.
We again stress that basing your investment decisions on only one indicator is not recommended. It is best to use it with one or two additional indicators of different types in order to confirm signals and prevent false alarms.
An ADX move below 40 from above indicates a trend slowing down. An ADX move above 20 from below indicates a new trend forming .


