A 2014 Conviction Buy Union Pacific Stock Deserves A Spot In Your Portfolio Union Pacific
Post on: 16 Март, 2015 No Comment

I always get a chuckle when Goldman Sachs publishes its Conviction Buy list. While there’s good names on it, I have wondered if there is a Just Regular Buy list, too? Nevertheless, in the spirit of the offing I write you with what I suggest may be a particularly compelling stock for 2014: Union Pacific Corporation (NYSE:UNP ).
Since Seeking Alpha editors published my last Union Pacific article in June, the stock has gained about 6.4% while the S&P 500 has done marginally better.
In this article, we will review why Union Pacific may be on track for exceptional growth, how corporate management remains a locomotive for shareholder returns and explore some probable stock price destinations.
First, Let’s Get Your Attention
Even if you decide to read no farther than this paragraph, the following one slide from the Union Pacific presentation at the Credit Suisse Global Industrial Conference may provide enough information to suggest why a UP investment may be worthy for consideration.
Total returns on Union Pacific stock have beat the S&P 500 for the past 1, 3, 5, 10 and 15-year periods.
Now, if you’re still interested, let’s take a look why it appears reasonable this grand story line won’t change much going forward.
Union Pacific Transports the Right Stuff
Despite overall tepid economic growth, a number of positive American themes have been percolating. Heading into 2014, three bright spots have demonstrated taking root:
What freight businesses play to Union Pacific strengths? You guessed it: housing, auto and energy. UP is especially well-situated to capitalize upon the movement of these goods. Indeed, the company generates about 22% of its total revenues via these lines.
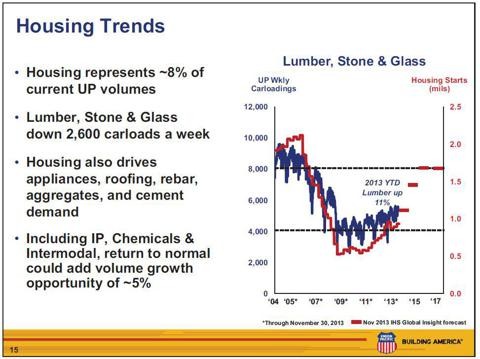
Historically, this railroad has shown strong ties to housing material shipments, particularly lumber. The following chart, part of the aforementioned Credit Suisse presentation, emphasizes this with an exclamation point.
While UP lumber carloadings have increased 11% this year, the nation remains far from the peak of a housing start cycle. Indeed, it seems we are only in the third inning.
The story behind automobile shipments is likewise impressive.
Automakers just recorded blockbuster November auto sales numbers, including the strongest selling rate since February 2007. The U.S. industry chalked up sales of 1.24 million light vehicles, an increase of 9 percent from strong year-earlier results. The annualized, seasonally adjusted rate (SAR) was 16.4 million vehicles. Coupled with the fact that the average American car on the road is about 11 years old, I believe the rebound is not over.
Furthermore, Union Pacific is the railroad of choice moving vehicles to-and-from Mexico. Year-over-Year Mexican FDI (Foreign Direct Investment) has rocketed from $13.4 billion to $33.4 billion. Automobile manufacturing and transportation comprise a significant portion of that figure.
Union Pacific is riding a crude oil-by-rail bonanza. Its rail service area runs through the midcontinent region: the heart of the energy boom. However, the oil, gas and shale explosion is not limited to moving hydrocarbons from wellhead to market. The average horizontal frac requires between 30 to 50 railcars of frac sand per well. Each well uses another 3 to 5 cars of drilling pipe.
Year-to-date frac sand shipments are up 22%. Pipe is up 3%. Crude-by-rail is up 36%.
Caveat! There are Some Challenges
Every company faces challenges and risks. Union Pacific coal volumes are in decline: about 20% of UP revenues come from transporting this commodity. However, there have been signs of bottoming. While I harbor no expectations of a rebound in coal, many North American utilities will continue to use coal as an energy source for a long time. It’s not going away. Much of Union Pacific’s declines have been the result of losing one major customer.
On the other hand, agricultural shipments have been down throughout most of 2013, primarily due to weather-related issues. I expect this to be a temporary phenomenon. Reversion to the mean should help offset weaker coal revenues and volumes. Agricultural transportation accounts for about 17% of UNP’s total revenues.
Union Pacific Means Business in Mexico
UNP is the strongest-situated carrier between the U.S. and Mexico. Between direct routes and its joint venture with Kansas City Southern (NYSE:KSU ), Union Pacific is dynamite down south. No other U.S. carrier has six major border interchange points. Volume growth has been outstanding, and there’s plenty of headroom. This following chart offers a good synopsis.
In addition to Mexican transportation, Union Pacific has the added leverage of moving goods to Asian markets via its West Coast ports and interchanges. UP’s eastern railroad counterparts don’t have this Asian connection advantage; transporting U.S. freight west bypasses Asian goods having to go south through the Panama Canal. Union Pacific routes save shippers time and money.
Strong Management Runs the Business for its Shareholders
My previous Seeking Alpha article about UNP outlined its superior balance sheet, returns and margins versus peers. Now let’s focus upon management’s drive to create shareholder value. Indeed, good investors seek senior leadership commitment to shareholders, and UNP has got it in spades.
Aggressive dividend increases and meaningful stock repurchase plans set Union Pacific apart. Courtesy of F.A.S.T. Graphs. please find below a 7-year chart showing increasing dividends and a reduction in common shares.
How about the future?
Recently, UP management offered up its vision for future cash allocation and shareholder return of capital.
The scenario certainly appears stockholder-friendly. In particular, fully half of operating cash is earmarked for shareholders. Since 3Q 2007, Union Pacific has quadrupled the quarterly cash dividend and repurchased about $8.5 billion in stock. The pace for both is expected to quicken.
The revised, stated dividend payout range has been increased to 30 to 35 percent, and a new 4-year share repurchase authorization will continue to take down the diluted share count.
I like the fact that management sets specific return of capital metrics: equity owners know the score upfront.
Valuation: Where’s the Stock Price Headed?
Just because a company is well-run and shareholder-friendly doesn’t mean the stock offers investment value. The shares may be over-priced. Therefore, let’s take a look at projected earnings growth and historical valuation metrics to see if the stock appears above or below fair value.
Utilizing F.A.S.T. graphs helps to provide a longer-term pictorial view of the situation.

First, here’s a 10-year chart depicting Union Pacific price, operating earnings, and normalized price/earnings multiple:
It’s easy to see that price (the black line) tracks earnings (the purple shaded area) and the historic P/E ratio (the blue line) quite closely. On the right side of the chart in the blue box, we note that over the past 10 years, the Normal P/E Ratio has been about 17x.
The chart also offers the 10-year annualized operating earnings growth rate has been about 16%.
Another P/E ratio check I like to use is utilization of a modified Graham Formula:
Fair Value PE = 9 + 0.5G where G is the earnings growth rate
In our case, historic G has been about 16%, therefore the expected PE for the stock should have been about 17x.
Given the ttm P/E is 17.6x, the stock is at fair value today.
Having established ratable rear-view metrics, we can now attempt to reasonably project the stock price going forward.
Another F.A.S.T. graph helps sort this out quickly. The Estimated Earnings and Returns Calculator provides consensus forward earnings estimates and a way to bridge these figures into a projected future stock price.
I like to place considerably more emphasis upon near-term earnings forecasts versus the out years. It’s hard enough to project a year or two out, let alone five. Analyst consensus indicates that Union Pacific operating earnings will increase by 16% next year and 15% in 2015. If we accept that as reasonable, placing a prudent P/E multiple upon such projected earnings to determine a target price.
Since we know that the past 10 years has seen an ACTUAL 16% earnings growth rate, and given the aforementioned Union Pacific story line whereas the future looks as bright as the past, let’s use the analyst projected EPS growth rate.
Moving along the P/E curves on the chart, I selected the 16.5x and 18.0x ratios as most likely to approximate fair value multiples in 2014 and 2015. This remains consistent with the previous 10-year historic price/earnings ratio.
As highlighted by the yellow marks, we find that multiplying the forecast operating earnings by the expected P/Es provides a target range for the shares:
Based upon projected 2014 EPS, a target price of $179.85 to $196.20 is calculated; and for 2015, we obtain a $206.83 to $225.63 spread. Given a recent share price of $164.50, gains of 10 to 20% per year may lie ahead. Dividends simply adds gloss to the scenario.
Please do you own careful due diligence before making any investment, or consult a financial advisor. Good luck with all your 2013 investments.
Disclosure: I am long UNP. I wrote this article myself, and it expresses my own opinions. I am not receiving compensation for it (other than from Seeking Alpha). I have no business relationship with any company whose stock is mentioned in this article.
Additional disclosure: I added to my position after writing this article.
Since you’ve shown interest in UNP, you may also be interested in


