What is the Parabolic SAR Indicator
Post on: 16 Июнь, 2015 No Comment

J. Welles Wilder
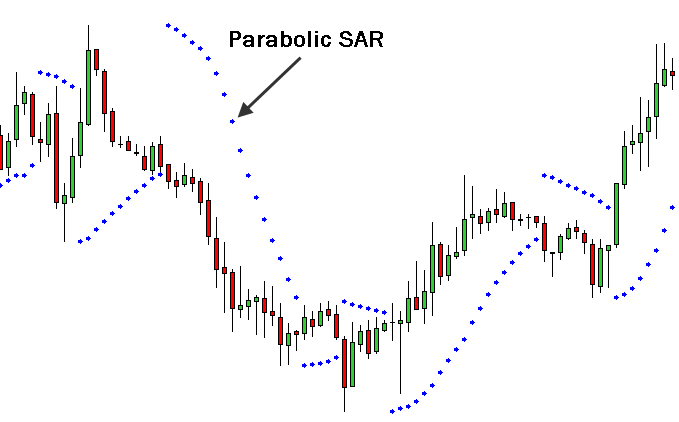
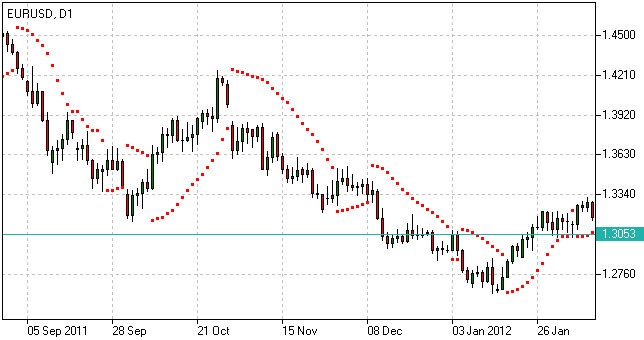
Parabolic SAR, short for Stop and Reverse is a technical indicator developed by J. Welles Wilder. The PSAR indicator is used to primarily determine the direction of price and the points at which price tends to reverse and move in the opposite direction. The Parabolic SAR can be identified by the dots that are drawn on the charts, showing potential price points of reversal and are plotted either above or below the instruments price. The PSAR trails price by plotting the dots either below the price during an uptrend or above the price during a down trend. These are also known as Rising SAR or Falling SAR.
The Parabolic SAR is a free trading indicator that is usually available by default in most trading platforms.
PSAR can be used to identify potential price reversals thus giving signals to enter a trade and is also commonly used to assist trades in setting up trailing stops.
Using the Parabolic SAR
The Parabolic SAR has two settings Step and Maximum
The STEP default setting is 0.02. The STEP in Parabolic SAR is used to calculate the next step in a trend based on the current PSAR value. The STEP is calculated based on EP or Extreme Point which is nothing but the high or low in a candle.
The maximum is the maximum acceleration point in the PSAR. By changing the value of STEP the sensitivity of the PSAR can be changed. The lower the value, the more sensitive the PSAR is (and often leads to repainting) and vice versa. Welders suggests to use the default settings as is and to use 0.01 for trading stocks.

Rising and Falling PSAR
Trading with Parabolic SAR
As with any other indicator, Parabolic SAR should be used as part of a trading system, in conjunction with other indicators to gain a better perspective. For example, the PSAR is best used with an oscillator such as RSI. CCI and so on. To get the best results from PSAR, a proven way to trade is to use PSAR with Bollinger Bands ®. We know that Bollinger Bands ® tends to plot the price points as a standard deviation of a moving average. As such, using PSAR, traders can confirm their entry/exit signals.
Besides using PSAR for trade entry confirmation, it can also be used as an effective trailing stop indicator. Traders simply move their stops as and when a new PSAR value is plotted on a chart. In the chart below we can see how PSAR helps us to determine the trailing stops thus allowing us to ride the trend to its potential.
To conclude, PSAR forms an important indicator for traders. Its simplicity has given rise to the PSAR being used in most trading systems in order to identify price points, especially in a trend trading system.


