What is moving average
Post on: 16 Март, 2015 No Comment

Understanding Moving average
by J Victor on January 20th, 2011
An average that moves!
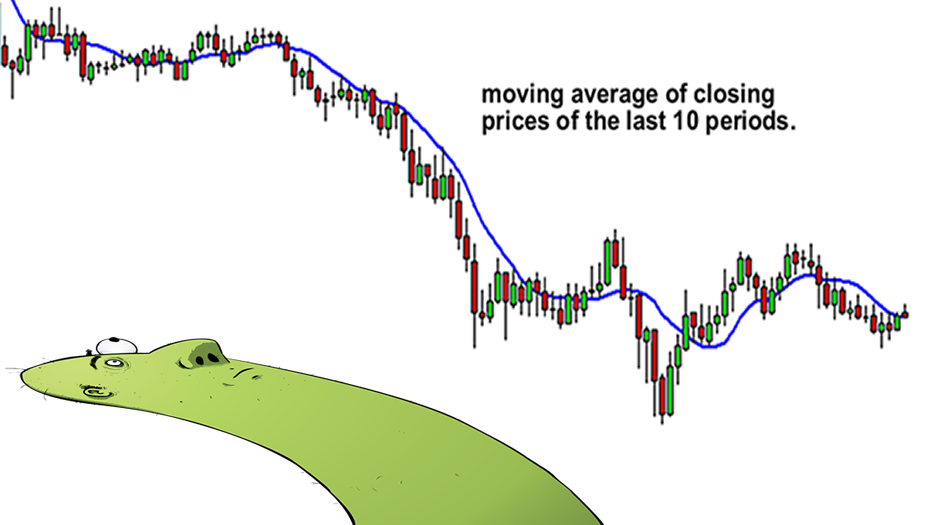
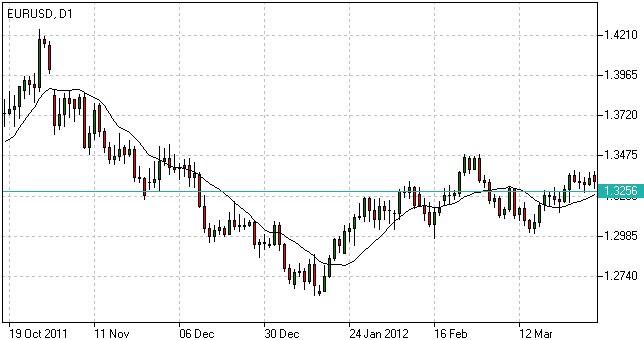
As its name implies, a moving average is an average that moves. They do not predict price direction, but rather show the current direction with a lag. Moving averages are based on past prices, which mean they will lag behind current prices. It will be presented in graphical form on your online stock trading terminal. Moving averages form the building blocks for many other technical indicators and overlays, such as Bollinger bands and MACD (explained later in this section). Most analysts use the 50 day, 100 day and the 200 day moving averages.
The 200-day moving average is the important moving average.
Example: To begin calculating a 200-day moving average of Infosys, the closing prices of Infosys over the last 200 days would be added together, and then divided by 200. That provides the average price at which Infosys was sold over the last 200 days. That point would be marked on the chart today. To make the average move, each subsequent day the same process is repeated, and the new point is added to the chart. After a few weeks you have the 200-day moving average moving along the chart where its relationship to Infosyss price each day can be seen. Note that in calculating the moving average each day, the oldest of the 200 closes is dropped and the new days close is added (Only the prices over the most recent 200 days are added together and divided by 200 each day).
So, the 200-day moving average is simply a shares average closing price over the last 200 days. The 200-day moving average is perceived to be the dividing line between a stock that is technically healthy and one that is not. Furthermore, the percentage of stocks above their 200-day moving average helps determine the overall health of the market. Many market traders also use moving averages to determine profitable entry and exit points into specific securities.
Purpose of moving averages:
Primary function of a moving average is to identify trends and reversals, measure the strength of an assets momentum and determine potential areas where an asset will find support or resistance.

Moving averages are easier to see and analyse on a chart. There are different types of moving averages-simple moving average (explained above) and exponential moving average. The Exponential Moving Average differs from a Simple Moving Average both by calculation method and in the way that prices are weighted. The Exponential Moving Average (shortened to the initials EMA) is effectively a weighted moving average. With the EMA, the weighting is such that the recent days prices are given more weight than older prices. The theory behind this is that more recent prices are considered to be more important than older prices, particularly as a long-term simple average (for example a 200 day) places equal weight on price data that is over 6 months old and could be thought of as slightly out-of-date.
A moving average can be a great risk management tool because of its ability to identify strategic areas to stop losses.
What is the right moving average?
Moving averages come in various forms, but their underlying purpose remains the same: to help technical traders track the trend of financial assets by smoothing out the day-to-day price fluctuations. There is nothing called ‘right moving average’. A 50-day moving average should be right for the intermediate term and 150 or 200-day moving average should work well for a long term investor.
You may like these posts:


