What is Japanese candlestick chart patterns and analysis
Post on: 23 Апрель, 2015 No Comment

History of candlestick charting
Japanese rice traders started using candlestick charts during 18th century for trading. Munehisa Homma a rice merchant,who is considered to be the father of candlestick analysis, used this extensively for his trading.He also used trader’s psychology as basis of his trading. He was considered as master of rice trading and had amassed lot of wealth from trading. He specialized in rice futures which was introduced in 1710 at Dojima Rice Exchange of Osaka.He also wrote some books on trading & psychology. These facts highlight that behavioural finance is an age old concept.
Homma studied historical data of rice trading, weather patterns, talked to other traders, analyzed the psychology behind price moves and came up with his strategy which became famous as “Sakata’s Strategy”
Now his candlestick charting principles are used by traders all over the world and also used to trade different markets like stocks, futures, currencies, commodities etc.
What is candlestick?
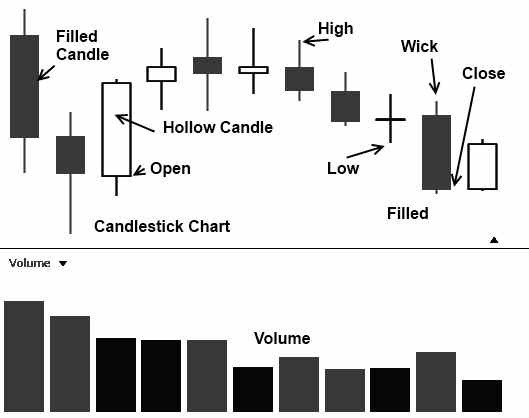
Before we get into candlestick analysis let us understand its basic component.Only 4 data points are required to draw an individual candle:
- Opening price
- Closing price
- Day’s low
- Day’s high

These are the same data points required to draw an individual bar in the bar chart. The main difference is candlesticks are more visual and this is because candlesticks are drawn differently and that makes them relatively easy to interpret. Candlestick chart conveys all the information which a bar chart conveys and with the added advantage of being more visual and easy to interpret.
The space between the open and close of the candle is called body of the candle and its the rectangular section of the candlestick.
If the closing price is higher than the opening price then its considered as bullish and the rectangular section usually is coloured in green or white.
If the closing price is lower than the opening price then its considered as bearish and the rectangular section usually is coloured in red or black.
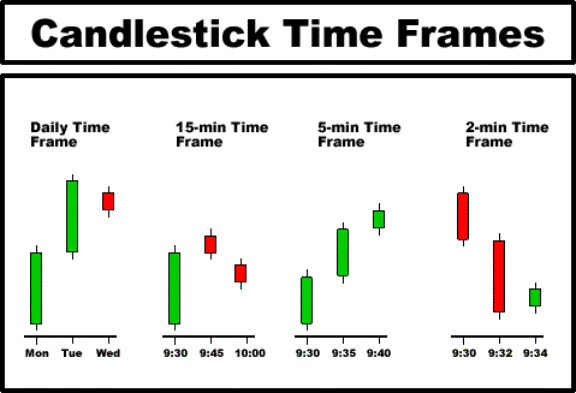
The line connecting the upper end of body to the day’s high or lower end of the body to day’s low is referred as tail or wick or shadow. The length of the wick or tail or shadow plays an important role in candlestick analysis.The line drawn at top is sometimes referred as upper shadow or hair and the line drawn at bottom is sometimes referred as lower shadow or tail.The extent of bullishness and bearishness depends on body colour, body & shadow length and these points are covered in detail in the other articles.Candlesticks are used for day trading, swing trading and also position trading.
How to read?
The length & colour of the body and length of the shadow(wick/tail) helps us to identify the dominant force in market. It gives us a clue on demand and supply situation and also the market sentiment. Even Though single candlestick helps us to understand the underlying market sentiment, it is only when we analyze with series of previous data that we will get a big picture.Candlestick analysis helps us in trading decision. Some people use candlestick along with other indicators and this helps in getting a good perspective of market. At end of the day there is nothing sure in market and it is all based on probability.
Candlestick Patterns
Some of the examples for candlestick patterns,which are explained in detail in other articles, are shooting star, harami,hammer,engulfing patterns,doji,handing man, evening star, dark cloud cover, 3 white soldiers etc


