What Is Elliott Wave Theory_1
Post on: 7 Май, 2015 No Comment

Elliott Waves 101
The Elliott Wave Principle is a detailed description of how groups of people behave, according to Elliott Wave International. Unlike many other trading systems, Elliott waves seek to identify probable rather than certain moves in a given direction. Traders must assess the individual probability of each situation given other technical and fundamental factors that might be at play.
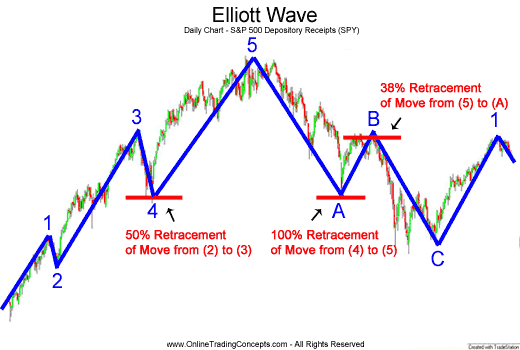
In practice, market technicians using Elliott waves look for specific patterns in a stock price. Impulse waves are price movements with the larger trend, which can be broken down into five subwaves. On the other hand, corrective waves are price movements against the larger trend, which can be broken down into three subwaves. These patterns combine into five- and three-wave structures.
Fibonacci ratios are used to effectively qualify various waves. For example, an impulse wave’s subsequent corrective wave might be a correction in Fibonacci proportions of 38%, 50%, or 62%. Similarly, impulse waves after corrective waves might rise in relation to Fibonacci proportions. Most popular charting platforms offer Fibonacci retracement, projections, fans, and other tools.
Advanced Rules
Elliott wave practitioners use a variety of other rules and guidelines to help ensure that they are correctly identifying patterns. While the three rules are widely considered to be requirements for a valid wave, the additional guidelines are tendencies that may not occur all of the time. Elliott wave analysis tends to be subjective and traders must learn to identify patterns over time.
The three rules include:
- The second wave cannot retrace more than 100% of the first wave.
- The third wave can never be the shortest of the three impulse waves.
- The fourth wave can never overlap the first wave.
Three additional guidelines include:
- When the third wave is the longest impulse wave, the fifth wave will approximately equal the first wave.
- The second and fourth waves will alternate. For instance, if the second wave is a sharp correction, the fourth wave will be a flat correction, and vice versa.
- Corrections usually end up in the area of a prior fourth wave low after a five-impulse wave advance.
Since Elliott waves are fractal in nature, the patterns repeat themselves as a trader zooms in from long time periods to short time periods. Market technicians refer to these various levels of waves by a combination of letters and numbers.
Example: Yahoo Inc.
Elliott waves are best explained by looking at a real-life example, since actual prices are much less pretty than the theory. In these cases, it’s important to look at long-term tops and bottoms rather than short-term price volatility that can be random by many accounts. These tops and bottoms can be further confirmed using technical indicators as will be explored in the following section.
Figure 2
Yahoo Inc.’s price action in mid-2013 through mid-2014 showed a clear Elliott wave pattern over time. After the first impulse wave, the correction wave moved to the Fibonacci level of 50% before the second impulse wave began. The second correction wave again moved 38.2% lower, which represents another key Fibonacci level, before the third impulse wave moved to highs in early 2014.
In this case, traders could have used Elliott waves to enhance their odds of a successful trade over time. The fifth wave could have signaled a long-term reversal and a top that could have avoided the subsequent losses from the downturn. Buying at the key Fibonacci levels could have also enhanced profits during the five waves higher by enhancing the timing of the trades to optimize profits.
Of course, Elliott waves are most useful when looking at multiple timeframes with multiple Elliott waves within those time frames. For example, the end of the C wave above signifies the beginning of a new bullish or bearish Elliott wave. Looking at longer timeframes and larger patterns can help discern the overall trend and help make it easier to see where prices are headed over the subsequent patterns.
Risks & Considerations
Elliott waves are best used as a single part of a market technician’s toolbox instead of as a solo prediction technique. For instance, an Elliott wave predicting a rebound might be much more powerful in the context of a MACD crossover, low RSI reading, and potential ascending triangle breakout, while an Elliott wave contradicting various other technical indicators might not be as reliable.
Zooming in on the Yahoo Inc. example above, there are several other technical indicators that seem to confirm what’s happening as seen in Figure 3 below. The overbought RSI reading above 70 suggested a possible reversal, while the bearish MACD crossover confirmed it after the fact. Conversely, the bullish MACD crossover confirmed the rebound from the Fibonacci support level.
See Also: 25 Stocks Day Traders Love
- Multiple Timeframes. Traders should look for Elliott waves in multiple timeframes in order to ensure that they are not trading against long-term trends when buying into short-term trends.
- Seek Confirmation. Traders should look for confirmations of Elliott wave patterns by looking at other technical indicators, like RSI or MACD, as well as chart patterns, like ascending triangles or wedges.
See Also: Best Trend Trading Setups With Examples


