What Is Better For The Stock Market – Republican Or Democrat Jack
Post on: 16 Май, 2015 No Comment

What Is Better For The Stock Market – Republican Or Democrat? 0 comments
Apr 2, 2012 11:16 AM
One of the biggest questions facing voters before each presidential election is which candidate will do better for the U.S. economy over the course of their term. While an improving economy means different things to different people, a simple gauge for the U.S. economy is the stock market. Increasing stock prices are normally an indication of improving fundamentals and can have many positive implications for the economy such as a lower unemployment rate, increased capital investment by U.S. corporations, and increased private wealth in the form of larger retirement accounts and 401k’s. For the purposes of this post, we are going to use the S&P 500 to measure stock market performance.
Before the 2008 election, the New York Times published this great visualization that showed the stock market returns under each president since 1929:
As you can see, the stock market has greatly outperformed under Democratic leadership with average returns of 8.9% versus the 0.4% average returns under Republican leadership. However there are a few interesting caveats that should be pointed out before jumping to the conclusion that Democratic candidates are automatically better for the stock market. If you exclude Herbert Hoover, who was president during the Great Depression, the Republicans average return increases to 4.7%. Another interesting note is that there are four Republican presidents (Bush Sr. Eisenhower, Ford, and Reagan) who averaged annualized gains over 10% versus only one for the Democrats (Clinton).
All this information above is based on data compiled by the New York Times up to 10/10/2008. Since then, President George W. Bush’s term came to an end (1/20/2009), and President Obama has had over three years in office. Therefore I wanted to compile the most recent data to see where we stand as of today, March 23rd, 2012.
Below is a graph of the S&P 500 dating back to 1950, segmented by each presidential term:
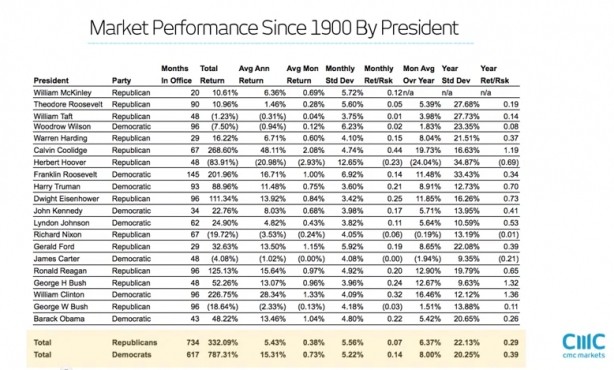
Looking at the updated data, President George W. Bush’s return did not change much from the data in the above illustration. He ended his second term on 1/20/2009, at which the S&P 500 had lost -40% since he first entered office, or -5% annualized. Whether it was a mere coincidence or a result of anticipated policy change, the stock market bottomed less than two months after President Barack Obama took office. From 1/20/2009, to the date of this writing, 3/23/2012, the S&P 500 has gone up 73.5%, or 24.5% annualized.
Take what you will from the data presented here. If we go strictly by the raw numbers, the stock market has vastly outperformed under Democratic leadership in Washington. Most of this outperformance is due to our two most recent Democratic presidents, Bill Clinton (15.2% annualized) and Barack Obama (24.5% annualized). On the other hand, the Republicans have had double the number of +10.0% annualized presidencies with four presidents compared to the Democrats two.
At the end of the day many on both sides of the aisle will argue on behalf of different conclusions that can be made based off of these numbers. However one thing is certain — the data clearly shows that the myth that stocks NEED to have a Republican in control to go higher, is simply not true. Therfore it is important to start learning how to buy stocks regardless of whether a Republican or Democrat is in power.
Disclosure: I have no positions in any stocks mentioned, and no plans to initiate any positions within the next 72 hours.
Instablogs are blogs which are instantly set up and networked within the Seeking Alpha community. Instablog posts are not selected, edited or screened by Seeking Alpha editors, in contrast to contributors’ articles.


