What is a Technical Trading Indicator
Post on: 16 Март, 2015 No Comment

on Tuesday, 22 October 2013. Posted in Trading Tips & Techniques
In the financial markets many traders rely on technical indicators for information to assist them in making a trading decision. Each technical trading indicator has its own properties and algorithms that are used to determine certain details about any given instrument. Let’s look at what a technical trading indicator is and how to use indicators for your benefit. In the examples below we are going to use two types of technical trading indicators.
To define an indicator, it is a mathematical calculation primarily based on price movement over a specified time period. The calculation(s) are used to present a graphical representation on a price chart to assist in technical analysis including entry and exit points.
1. Lagging Indicators
Lagging indicators tend to use the current movement of price to determine calculations which present a graphical representation on a price chart. These indicators are most commonly used as a form of confirmation for a given trade. The information gained from lagging indicators saves time by constantly applying the specified calculation and relaying that on the price chart. Lagging indicators can be applied to most all trading strategies, however a trader must be able to interpret this information to determine a potential trade entry or exit. Simply put, lagging indicators are best used for confirming what you have determined using other means of analysis.
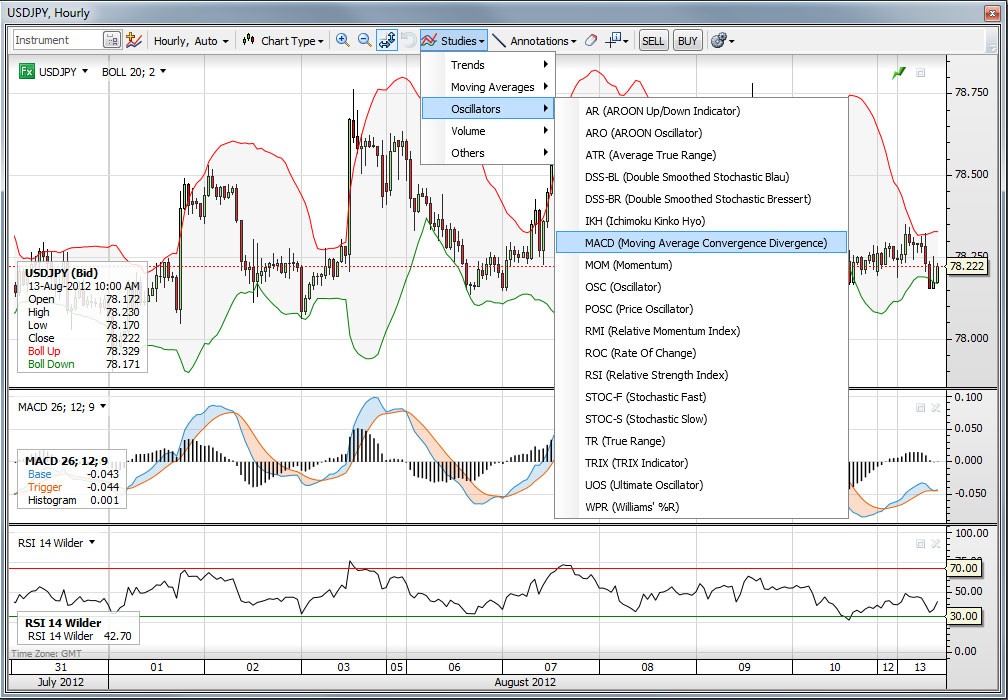
Example: RSI, Stochastics, Bollinger Band, MACD and many more!
Image 1: As indicated above a lagging indicator uses current data to determine what graphical representation to relay. In the image below you can see how price simply follows the movement of price.
2. Leading Indicators
Leading indicators are used to determine the future movement of price making them predictive. They too apply a graphical representation on a price chart in many cases using defined algorithms to predict upcoming direction and/or reversals. Leading indicators are commonly used for defined entry and exit points without any form of confirmation. Simply put, leading indicators give a trader an edge in the market and may be used alone or in conjunction with lagging indicators to reduce emotional trading.
Image 2: Below is a price chart which appears in an uptrend. The PFA Zoning MTF has indicated an area of institutional buying which is used to determine an entry point for the future movement of price.
Image 3: Below is a follow up of the above (Image 2). Using pre determined price levels we are able to anticipate where price is most likely to turn. In this case price formed a downtrend to return to the level of institutional buying. If using an lagging indicator this information would not show on the price chart until it has already occured.
In conclusion both Leading and Lagging indicators are useful in trading and will greatly depend on the individual trader’s preference and trading style. Knowing What a technical trading indicator is gives any trader more knowledge but in order to benefit any trading style each should be backtested heavily to determine if it is suitable for your trading.


