WHAT DOES PRICE EARNINGS (PE) RATIO MEAN
Post on: 17 Май, 2015 No Comment

Part 1 in a series of stock evaluation metrics
Understanding the PE Ratio
Most investors are best suited to invest in a diversified portfolio of index funds in an asset allocation in line with their risk tolerance. The research is quite clear that it is exceedingly difficult to beat the overall stock market over time. That said, there are those who like to analyze individual stocks and attempt to beat the market. For those active investors, as well as those interested in understanding a bit more about investing, I’ll cover some of the popular stock evaluation ratios in this series.
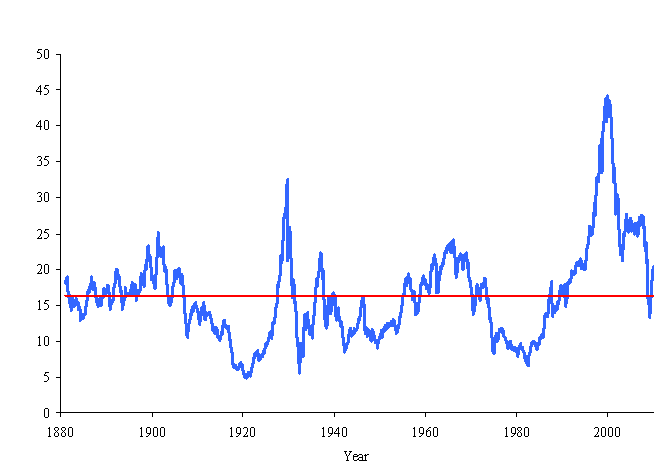
Prognosticators predict the future direction of the stock markets. There is no proof that over time anyone has consistently done a good job at this forecasting. In most cases correct predictions could just as easily be attributed to luck and skill. The main problem with forecasting the overall stock market is this; although one might be able to correctly pinpoint an overvalued stock market, in comparison with historical norms, there is no way to determine how long that overvalued market might continue to remain overvalued. Or, if that said market might become even more overvalued.
“Markets can remain overvalued longer than you can stay solvent.” John Maynard Keynes
In spite of the difficulty in predicting the future direction of the stock market, the PE ratio is a useful tool to use as a guide to relative valuation of both individual stocks and markets in general.
How to Interpret a Price Earnings Ratio
As I teach in my university Investments class, the price earnings ratio, or PE ratio is a method to value an individual stock or an aggregate stock market. Simply take the current price and divide by last year’s earnings. For example, if a stock, ABC, is selling for $20.00 per share and last year’s earnings were $.75 per share, then the PE would be 20/.75 or 26.7. The 26.7 means investors are willing to pay $26.70 for each $1.00 of earnings of ABC stock. Higher PE’s suggest investors expect higher growth from the company.
Great, you have the PE ratio, but what does it mean? Is 26.7 good or bad? If a stock has a PE ratio of 26.7 does that mean it’s over or undervalued? Should I continue considering a stock for purchase with a PE ratio of 26.7?
Unlike buying a pair of shoes where $35.00 is cheap and $150.00 is expensive, understanding a PE ratio is not so easy.
1. Specific industries have specific PE ratio ranges. For example it might be normal for a slow growing utility company to have a PE ratio between 6 and 10. Whereas a fast growing technology company might typically have a PE ratio in the range of 14 to 26.
2. Individual companies also have ranges in which their stock usually trades. Let’s assume ABC had a PE ratio between 16 and 28 during the past five years. Next let’s look at the 5 year range of ABC’s industry and see that the companies in ABC’s industry typically have a PE between 16 and 24. What does that data suggest about ABC’s PE of 26.7
3. Evaluate a company’s PE ratio in comparison with its own five year average and that of its industry.
4. In comparison with its own historical PE range, ABC is very near the highest PE ratio of 28. In comparison with ABC’s industry 5 year PE range, ABC’s 26.7 PE ratio is higher than the industry 5 year peak of 24. This means that according to the PE valuation measure, ABC is overvalued.
Generally, when a company has a PE range near its 5 year high, it is usually considered overvalued.
What Should an Investor do When a Stock or Market PE is Near a Peak?
If you were researching the stock for potential purchase, it’s a good idea to look for a company whose relative PE is lower. If you already hold this company in your portfolio, there’s nothing to state that this company will not continue to trade at a relatively high PE. Research has shown that over the long run, high PE stocks offer lower future returns than lower PE stocks. Yet, in the short term anything can happen.
In summary, a quick PE study is an efficient way to get a ball park valuation of a stock. If you’re looking for stock candidates for potential purchase, check out the company and industry’s historical PE’s to determine whether you want to research further, or move on to the next one.
Have you ever done a PE ratio analysis or are you more of an index mutual fund investor?
Very good explanation! Heres the biggest problem: how do you know youve hit a peak? A rising chart today could keep rising tomorrow, or just as easily turn down.
A peak, by its definition, only manifests AFTER it happened. If any of us could call a peak before the turn-down, wed be billionaires. Furthermore, when there is a down-tick, how do we know its a real turn or just another little hiccup, because prices always move up and down in fits and starts.
Take Whole Foods and Apple. Whole Foods has a PE around 30 and Apple around 10. So, is Whole Foods going to peak? We all know it has to at some point, because all growth companies run out of growth some time. But is that this year? Or ten years from now?
That all said, I think you nailed the essence of valuing a stock or the market: the PE is the number we need to keep our eye on, probably more than any other.
3A%2F%2F1.gravatar.com%2Favatar%2Fad516503a11cd5ca435acc9bb6523536%3Fs%3D75&r=G /% William @ Bite the Bullet


