What Are The Best Technical Indicators
Post on: 16 Март, 2015 No Comment

Technical analysis of the stock market (or any other market such as Forex, Bonds or Futures) using technical indicators , is how most traders and investors make their trading decisions. This is as opposed to fundamental analysis which most people more agree, is pretty much useless these days, as a way of making trading decisions, unless of course you are Warren Buffet!.
You only have to think back to major stock market scams like Enron to know that it is almost impossible for the average, and even very sophisticated fund manager or hedge fund trader to really know what the real financial state of a company is.
Just by reading the balance sheet and other quarterly reports they release gives you a very limited insight into the real health of the company. Whereas the technical charts of the company tend to give the real picture of what the market thinks of the value of the company. In the case of Enron even simple technical analysis told you to SELL when the stock was in the $80-90 range, this is why technical analysis of stocks is so popular.
So what is the secret to technical analysis. I’m about to tell you, here are my golden rules:
- Only use 3-5 simple technical analysis indicators
- Make sure that you understand how the indicators that you have selected work. what the parameter settings are and in what market conditions they are effective
- After selecting your indicators and parameter settings don’t mess with them.
The real secret to technical analysis is to get VERY familiar with your choosen indicators, and really this can only be done by watching and studying the market for a long time, so that you get to the point that you TRUST them.
There is no shortcut to becoming an expert in technical analysis, its a very visual thing and you simply have to put in the time to train your brain

The fact is that in any market, for each bar, there are only 5 pieces of information. the open, close, high, low and volume, yet there are now hundreds of indicators. Most of these indicators are displaying much the same information and so are redundant.
For the record my set of indicators are:
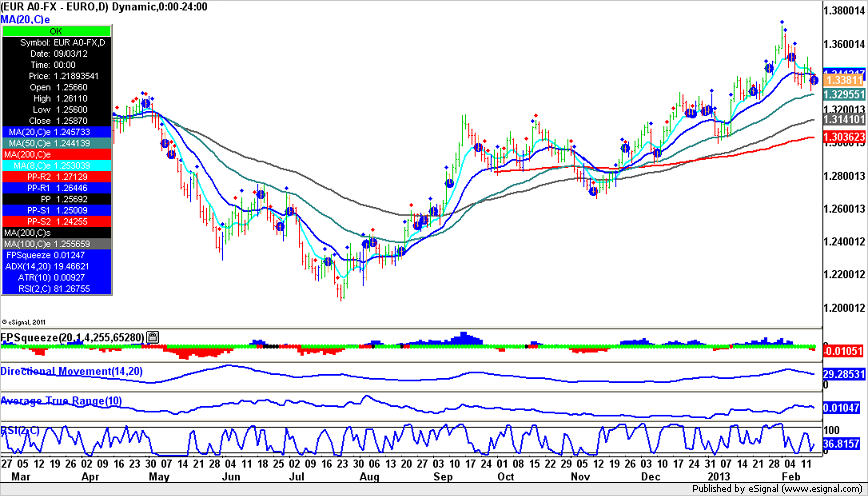
* 4 Simple Moving Averages
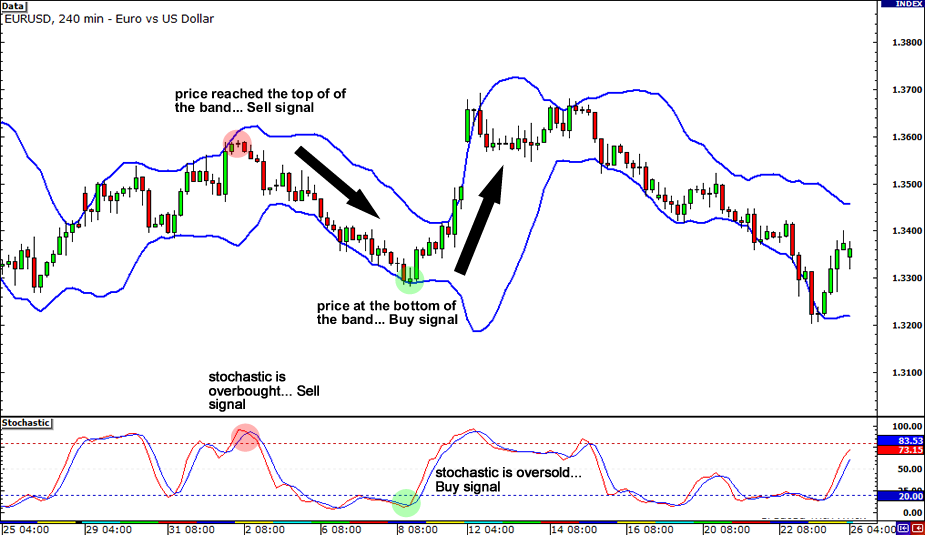
* Bollinger Bands
* MACD
* Stochastics
But the way I use them is quite special
Combine using these simple technical indicators, in the correct way, with knowledge of the 5 chart characteristics that are present in any chart and you will have an understanding of technical analysis that puts you in the top 1% of traders
To learn more about how to become an expert at technical analysis subscribe for some free training from Dr Barry Burns Top Dog Trading Free Trading Course
Trust me on this one, you dont want to miss this free course!


