What Are Heikin Ashi Candlestick Charts
Post on: 26 Апрель, 2015 No Comment

Candlestick analysis has quickly gone from being an obscure, seldom used method of technical analysis to being one of the most popular ways to interpret stock charts in a very short period of time.
A trader by the name of Steve Nison is who is credited with popularizing the once underground secrets of Japanese candlestick charting techniques.
Candlestick analysis provides the trader a much deeper look into price movement on stock charts than simple bar based stock charts. In addition, candlestick based stock charts are much easier on the eyes and able to be quickly interpreted visually.
This quick interpretation makes physically screening for stocks to trade, by scrolling through charts, a much easier endeavor than the regular bar charts.
The simplest way to use candlesticks is to determine buying or selling pressure during a particular candlestick formation.
A long white candlestick is signaling strong buying pressure during that time period. While a long black candlestick is a sign of strong selling pressure.
Remember, long or short candlesticks are not exactly defined. They are relative to the surrounding candlesticks of the same time frame.
Long white candlesticks appearing after downtrends can be a signal that the trend has reversed and it’s time to enter long positions.
At the same time, a long black candlestick appearing after an extended uptrend often signals that the upward trend has exhausted itself and its time to short the stock.
Short white candlesticks indicate bullish consolidation, while short black candlesticks generally signal bearish consolidation pressure on the shares.
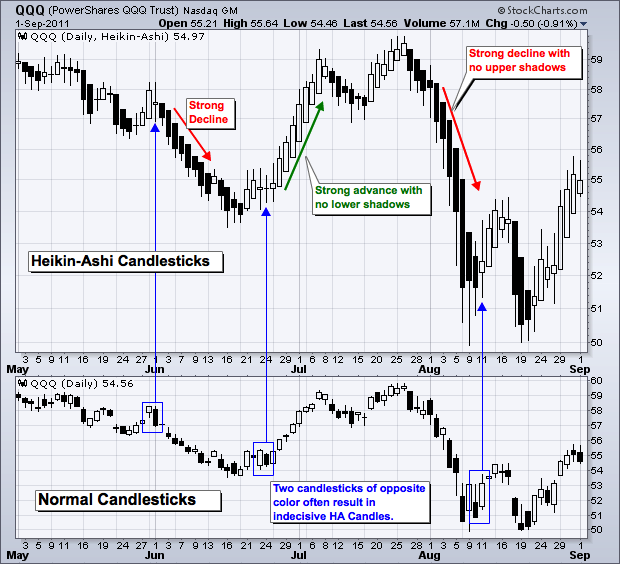
A rarely used but highly effective candlestick type is called Heikin Ashi.
Heikin Ashi stock market candle stick charts make trends easier to identify since they average each move. In fact, Heikin Ashi means “average bar” in Japanese.
Some technical analysis charting software has Heikin Ashi candle stick charting capacity as a standard feature. Others have it available as a modular add on feature. Regardless, it’s smart to understand how the Heikin Ashi candles are constructed. Here’s how:
xClose = (Open+High+Low+Close)/4
o Average price of the current bar
xOpen = [xOpen(Previous Bar) + Close(Previous Bar)]/2
o Midpoint of the previous bar
xHigh = Max(High, xOpen, xClose)
o Highest value in the set
xLow = Min(Low, xOpen, xClose)
o Lowest value in the set
The Heikin-Ashi candle stick stock chart is built like a standard candlestick chart with the add on of the new values above. The time sequence is defined by the userdepending on the type of trading being pursued (daily, hourly, long term). The down periods are represented by colored bars, while the up days are represented by open bars. Finally, all of the traditional candle stick patterns can be used with the Heikin Ashi chart.
Looking for technical analysis books? This one is FREE. Download our FREE special report, Technical Analysis: Understanding Stock Charts and Momentum Indicators to Maximize Your ROI right now, and start making more money tomorrow!


