Weekend Bollinger Band Scan and High Tight Flags
Post on: 16 Март, 2015 No Comment

- William J. O’Neil
Homework.
Today’s quote pretty much says it all. We strive to bring you stocks that have potential. Not all will succeed in meeting our objectives. O’Neil is commonly known for his flagship periodical, Investors Business Daily and the CANSLIM method. Put this all together, our scans, your homework and ours and we find stocks like Diamondback Energy. FANG is a favorite of Mikey and a go to name he’s traded earlier in the year as well as recently. He covers how he takes the scan and researches same using CANSLIM in a recent video. be sure to check it out. Mikey’s FANG, chart below. Pay particular attention to the notes excerpted from IBD. FANG was also traded since the February breakout when energy showed up in mass on our scans. Below is my chart showing annotations from earlier in the year. Diamondback will likely continue to appreciate in price, even though its come a long way in 2014. FANG is currently breaking higher from it’s 3rd or 4th stage depending on your perspective. It just keeps stair stepping higher and higher. The weekend scan has a number of candidates. Be sure to do your homework on these. If you do nothing else check the earnings date. You don’t want to be caught blind sided with a bad report. Allegheny (ATI) with a nice pattern breaking out of Friday after a nice run up and consolidation. Energy names continue to breakout as we mentioned previously. Baker Hughes (BHI) is looking good. Prices are above the KIRBY and MACD has potential. IBD rating = 77. Patterson Energy (PTEN) is worth a look as it testes a triple top. Will it breakout or be rejected here? MACD suggests indecision as it moves sideways, suggesting a possible cross soon. C&J Energy Services (CJES) looks a bit better. With prices above the KIRBY, MACD attempting a cross, volume picking up and stochastic leading the turn. CJES may break out here. Watch List. Century Aluminum (CENX) was pointed out on Thursday’s scan. We were watching both Alcoa and Century. The price action suggested we take a closer look as we noted the volume and the fact that the KIRBY is non-existent as we break higher. We need a follow though on volume.
KIRBY is a @gtotoy term referring to the Volume at Price bars on the left side of the chart and the subsequent price action as prices move into a pocket where less volume has traded. Prices tend to get sucked higher or lower depending on the prevailing trend, as prices move into the KIRBY. (A vacuum manufacturer) Manitowoc (MTW) stopped right where we thought it might, as mentioned on the Thursday night blog post. Watch for a break above support and resistance here or a failure. Sanmina (SMNA) is tracing out a nice flat base (@HCPG — Base and Break pattern). Trade the direction of the breakout. MACD suggests we’ll see higher prices with stochastic echoing the thought as it turns. Bollinger bands are tight, so which ever way it moves it should be a nice one to watch, or trade. LOL. Rambus (RMBS) caught our attention a couple of weeks ago, though the descending pattern breakout was short lived. As we retested the upper trend line this week and bounced, the price action gave credence to possible continued upside appreciation. Note MACD and stochastic are signaling the same sentiment with traders.
HIGH TIGHT FLAG — SCAN

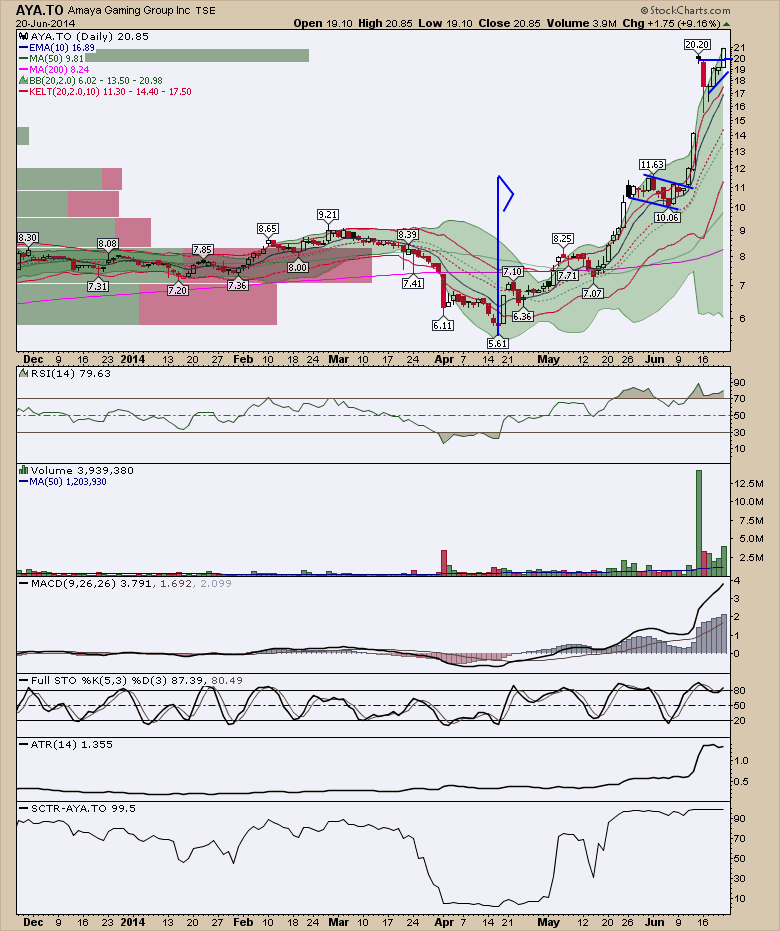
Radnet (RDNT) finally broke out on Friday. We added by way of a buy stop and now have a full position. The kids account (IRA) has a few hundred shares as well as the wife. Note when I was looking at this chart this weekend, I inadvertently pickup on, not one but two HTF patterns in this name. Note the earlier double from the 1.50 low and subsequent flag. The recent pocket pivots in volume were a welcome sign of confirmation for the current trade. Radnet is in the Imaging Diagnostics business. DVA the leader in the group. Davita (DVA), a trade earlier in the year, broke out before RDNT, giving us yet another reason to stick with the initial (anticipatory entry) trade thesis on RDNT. We would expect DVA to pull back and consolidate recent gains, perhaps with a flag. Air Canada was on the previous weekend watch list and scan candidates. The High Tight Flag portion of the larger cup in handle pattern did not disappoint those traders who took a shot last Monday. Volume confirmed on Friday. We would expect a flag as a possibility considering the recent move. If you’re in it, congratulations. Stops are now below Friday’s low of the day. Amaya Gaming (AYA.TO) is new this weekend. I don’t know anything about the company other than it trades on the Toronto Exchange (TSX) and the price action suggests a look. Blue Dolphin Energy (BDCO) is on the scan only because of the quick double in price. It is not a trade. We post it here only to show a HTF that appreciates very quickly and goes vertical is not a high probability setup. We are watching this for recordation purposes as Thomas Bulkowski pointed to these as less favorable HTF candidates in his book, Encyclopedia of Chart Patterns. China Plastic (CXDC) continues to perform. Note the pocket pivots and MACD continuing to move away from its signal line. If you took the trade, I would watch for any hesitation as it pushes higher. Watch for Goodrich Petroleum (GDP) to move higher soon. These patterns do fail, so be on watch for the 10% that do not complete the pattern.
We got back in on the PBBO, pull back to breakout, where buyers took control midday and stepped in to push prices off the lows. The fast appreciation off the February low, building the initial HTF, suggest institutions were accumulating shares. This action is one of the main reasons we like trading the pattern, accumulation by strong hands in a relatively short time period (<60 days). Our stops are below the Thursday low. Pampa Energy (PAM) continues higher. This trade broke out on Monday two weeks ago. Continue to move your stops higher. We like to use the previous day low and subtract (-25 cents) more or less depending on stock price as a manual trailing stop adjusted before the opening range. As an example of establishing target, using Thomas Bulkowski’s statistics on HTF, most of these stocks (90%) appreciate 1/2 of the previous run up in prices. Use these stats for your future targets. See below, an excerpt from Encyclopedia of Chart Patterns, a great book if you’re serious about increasing your odds of winning at trading.
Quest Resources (QRHC) is another name we have a 1/2 position in going into the weekend. We took the trade in anticipation of a flag around 4.78 however the train never stopped long enough to second guess the entry (buy stop) at 4.80. We continue to move our stops higher on the remaining shares. ECOL is the leader in the group. Below is the scan for the weekend. Most of the HTF charts we like are posted herein. Remember, not all of these names fit the CANSLIM criteria so they are a bit more risky. I may or may not record a video later as it’s my son’t birthday, so this might be it for the weekend. Do your homework!


