Wary Leuthold IDs BounceBack Stocks
Post on: 19 Апрель, 2015 No Comment

Summary
- Back on October 3rd the Leuthold Group announced it had reduced its core portfolio equity exposure from 55% to 40% as its proprietary Major Trend Index (MTI) fell into negative territory.
- The MTI is a mash up of 130 metrics segmented into five broad categories that cover the waterfront: from intrinsic value to economic factors. Pegged to 100, a reading between 95-105 is considered neutral.
- In early October the reading fell to 90 triggering the reduction in equity exposure.
- The Leuthold Group also generated an interesting list of bounce-back candidates for further research.
By Carla Fried
Back on October 3rd the Leuthold Group announced it had reduced its core portfolio equity exposure from 55% to 40% as its proprietary Major Trend Index (MTI) fell into negative territory. The MTI is a mash up of 130 metrics segmented into five broad categories that cover the waterfront: from intrinsic value to economic factors. Pegged to 100, a reading between 95-105 is considered neutral. In early October the reading fell to 90 triggering the reduction in equity exposure. That said, Leuthold chief investment officer Doug Ramsey said the expectation is that were not headed into a recession, just a stock market event that we expect to be painful enough to temporarily warrant a defensive stance.
Indeed, the pullback that began in September has continued since the early October missive, as seen in the performance of the SPDR S&P 500 ETF (NYSEARCA:SPY ), the Vanguard Russell 2000 ETF (NASDAQ:VTWO ) and the iShares MSCI Core EAFE (NYSEARCA:IEFA ):
SPY data by YCharts
Ramsey points out that in the 14 intermediate corrections for the S&P 500 since 1990 (losses between 7% and 12%) the utility sector not surprisingly held on best, with an average loss of -3.1% and the sectors index rose in three of the corrections. That said, the sector is dicey at this juncture. If youre on board that one of the drivers of market volatility of late is the anticipation of rising rates, utility stocks that have been bond stand-ins will lose some of their allure for income seekers. And those income seekers have driven up valuations. All but one of the 30 utility stocks in the S&P 500 earn just a neutral rating from YCharts. The one utility stock you might want to target for further financial research if youre determined to take a severe flight to safety is AGL Resources (NYSE:GAS ) a regulated natural-gas distributor operating in New Jersey and the southeast, which currently has a Y-rating of Attractive.
A 13 trailing PE ratio for AGL Resources is sharply below the level for the two other regulated gas utilities in the S&P 500: CenterPoint Energy (NYSE:CNP ) is near 18 and NiSource (NYSE:NI ) is near 22. AGLs near 4% dividend yield today is coupled with very safe looking dividend capacity:
GAS Payout Ratio (TTM) data by YCharts

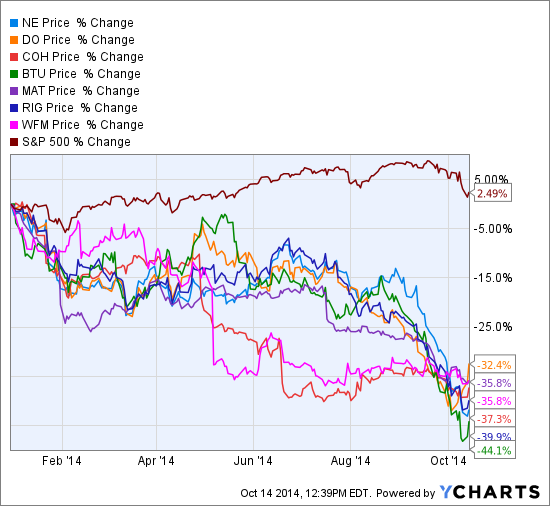
The Leuthold Group also generated an interesting list of bounce-back candidates for further research. It defines bounce-back season as running from October-January, but with the MTI recently heading south, theres no rush to jump on this strategy ASAP. The firms research has found that rather than drilling down to the biggest losers (from recent highs) a better strategy is to focus on stocks with less dramatic drops, the theory being that their downside momentum may have already abated. This bad-but-not-the-worst group has historically generated a 10% average gain during bounce-back season, compared to 6% for the S&P 500. Leuthold backs into this group by ranking S&P 1500 stocks by their declines from 2014 peaks and focusing on stocks whose losses fell into spots 51-100.
Its short list of candidates worth a look include S&P 500 constituents Noble Corporation (NYSE:NE ), Diamond Offshore Drilling (NYSE:DO ), Coach (NYSE:COH ), Peabody Electric (NYSE:BTU ), Mattel (NASDAQ:MAT ), TransOcean (NYSE:RIG ) and Whole Foods (NASDAQ:WFM ).
NE data by YCharts
But it gets interesting when you flip the time frame to the past month: both Whole Foods and Diamond Offshore Drilling have held on better than the S&P 500.
NE data by YCharts
Whole Foods hit the wall about this time last year, as concerns started to mount that a dip in operating margins was not what you want to see for a stock trading at a then-40+ trailing PE ratio .
Now that the multiple is back toward reality (around 24) its worth noting that Whole Foods softened operating margins arent anywhere near the razor thin levels for Safeway (NYSE:SWY ) and Kroger (NYSE:KR ).
WFM Operating Margin (Quarterly) data by YCharts
And it seems that the shorts are beginning to move onto other prey as Whole Foods stabilizing price has triggered a small decline in short interest:
WFM data by YCharts
And if youre concerned about the impact a strengthening dollar will have on companies with sizable international revenue, Whole Foods is a decidedly domestic operator. Less than 4% of fiscal year 2013 sales came from outside the United States.
Disclosure: None


