Volume – Volume Indicato Stock trading
Post on: 11 Июнь, 2015 No Comment

“Be a lamp unto yourself. Work out your liberation with diligence.” Buddha.
Dear “Liberated Stock Trader”, we hope your path runs true. In this section we discuss the value of Volume, and how it can assist in good Trading decisions.
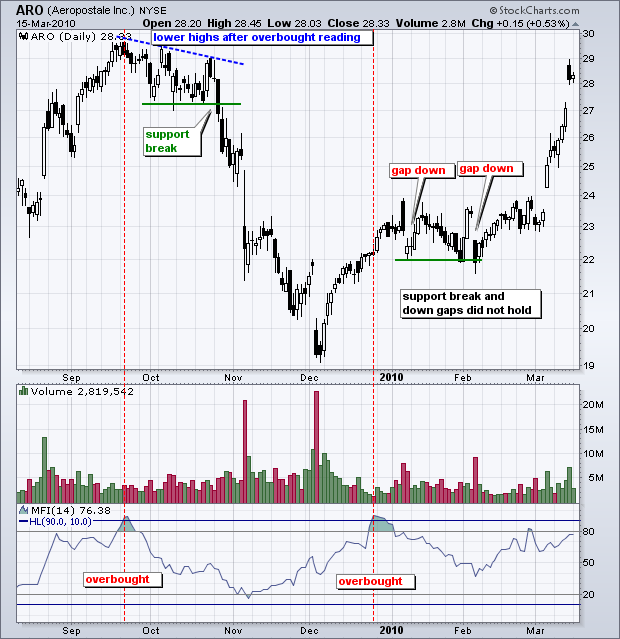
Volume in charts is usually expressed as the number of Shares traded that day. It is most useful to view volume indicators in comparison to what is the normal number of Shares traded for a stock on average. For example if volume starts to increase dramatically for a stock we can assume there has been some news, earnings release or otherwise external factors acting on the stock.
Look at the chart below for NetFlix (NFLX), a DVD rental “by post” company. Take a close look at volume and price and what they have in common. The volume indicator is configured to show a RED Bar if the closing price for the stock is lower that the opening price meaning “Negative Volume”, and green for days where the closing price is higher than the opening “Positive Volume”
So what did you see?
What happened to Volume when the price changed?
What happened to the price when volume spiked?
Did you notice the chart was on an Algorithmic Scale, not a Logarithmic? We can see this from the price moving in fixed increments $20, $22, $24. Always try to use logarithmic, it helps you view potential % gains and losses so much easier. Most professional technical analysts use Logarithmic scaling, it produces the best results.
The Learning Chart, now see the chart through the Liberated Stock Traders eyes.
In our lesson on volume, we focus on 2 key phrases
Now look at the chart below and read further for a description of the key concepts here. The Chart maps Price, Moving Averages 10 & 30, and volume (Red for Negative, Green for Positive).
Key Points, referenced in the Chart.
- here at point 1 we see a huge change in the direction of price, it was proceeding in a downward direction, then suddenly there was a spike in volume over 2 weeks, this is known as a “blow off bottom”. It indicates, that a key price has been founds, where the sellers have lost enough that they need to sell the stock, and the buyers have seen the price decrease enough so that they see real value in the Stock. Of course other factors contribute, like good News, or earnings results. Whatever happened volume increased!
- the stock here increases from $20 to $38 in the following 3 months, a 90% increase. but how would we know this was about to happen. Well, buying at the time the moving averages crossed over would have been a good option, it would not have provided the full 90%, but it would have produced 40%, which by anyone’s reckoning is an excellent result.
However here we see a monster “Blow off Top”, the huge red Spike, this is a very strong sign, to sell as soon as possible. From stage 2 we see the stock move in a sideways patter and eventually decrease back down to $19, the ride is well and truly over. However you would not own the stock, as you would have sold when the Moving Averages crossed.
The stock price starts to increase in mid November 2008, but volume tells us nothing, WHY?
Indicators do not tell us something 100% of the time. but when they do we need to recognize it.
The moving averages cross at $25, a good time to buy.

Why did it take off? We should always seek enlightenment!
It reported excellent earnings, and because of the recession people were switching from buying bigger ticket items such as Cars and Plasma TV’s to staying at home and renting Movies. Netflix reported a massive increase in new members.
Warning: Some volatile stocks show a lot of Gaps in price. While gaps in price might sound good when they gap upwards, if they gap down against you then they are very bad. Avoid stocks with any history of strong negative gapping. As Gaps do not give you the opportunity to sell at the price YOU want to. Buying and selling strategies will be discussed in an article later in the training series.
So what did we learn? Volume IS important and reading it should become second nature. Especially when searching for winning stocks, we ideally should look for stocks with increased volume so we have more chance of a quicker, less risk win. This will be discussed in Trading Strategies in a later training module.
This was a lot of information and it is an important tool for your toolbox.
Learn Stock Market Trading and Investing with FREE Education and Training on Stock Screening, Stock Charts, Candlesticks, Technical Analysis & Fundamental Analysis and Stock Chart Indicators, Trading Academy Membership is free register here.
Buy the Liberated Stock Trader PRO Training Package and receive 16 hours of video lessons and the Liberated Stock Trader Book — fast forward your future.
Guiding you through the maze of stock market investing to give you a uniquely practical and comprehensive knowledge of the 4 Pillars of Success
FUNDAMENTAL ANALYSIS — Learn how to analyze the health of the business climate and how to find great companies using our practical stock screening guide.
TECHNICAL ANALYSIS – Chart Reading is not Voodoo, it is science. YOU will gain an incredible understanding of expert charting techniques, covering the most important methods, indicators and tactics, to enable you to time your trades to perfection.
MONEY MANAGEMENT – Understand how many stocks to buy, when to buy them, how much to invest and when to sell using expert stop-loss strategies.
STOCK MARKET STRATEGY – Develop your own stock market strategy and learn how to create your own winning stock system.


