Volatility and Market Trading Ranges
Post on: 16 Март, 2015 No Comment

Posted on Wednesday, April 27th, 2011 at 9:45 pm.
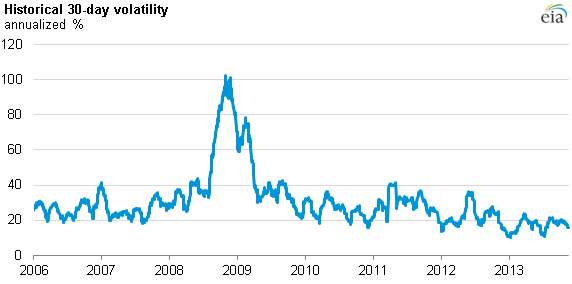
There has been a lot of discussion lately in the financial press about how market volatility has dropped in recent months. The VIX, a popular measure of market volatility, is now as low as it has been in four years. Traders have seen the price of options fall, and as a result, premium collection strategies have not performed well lately. Some traders have been profiting from the low VIX by shorting exchange traded funds that seek to track the VIX, such as the VXX. In this article I will briefly explain how the VIX and VXX are calculated, and then look at the actual trading ranges of some popular markets to look for evidence of this lower volatility.
The VIX is the ticker symbol for what is called the Market Volatility Index and was first introduced in 1993 by the Chicago Board Options Exchange. Today it is calculated by using the out-of-the-money call and put options prices on the S&P 500 Index. Options prices are determined using complex models that take into account a number of parameters, one of them being implied volatility. If traders are anticipating large movements in stock prices, either up or down, then the price for all call and put options will go up. Conversely, if traders believe that the markets will experience little movement, options premiums will be lower. With all other things being equal, higher volatility of the underlying stocks of the S&P 500 Index makes the corresponding options more valuable (since there is a greater probability that the options will expire in the money) and this in turn increases the value of S&P 500 Index options.
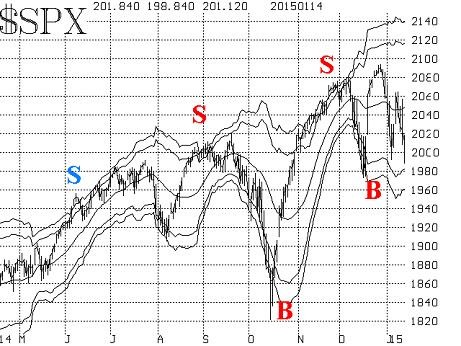
By using a formula which weights the call and put option prices on the S&P 500 Index, a value for the VIX is calculated so that it is quoted in annualized percentage points that corresponds roughly to the expected movement in the S&P 500 Index over the next 30 days. Practically speaking, VIX values greater than 30 are associated with higher volatility, and VIX values lower than 20 are associated with lower volatility. As of this writing, the VIX is around 15, which is quite low. The VIX if often referred to as the “fear index” or “investor fear gauge”, but that is actually a misnomer because the VIX is a measure of perceived market volatility in either direction.
Over the last several years, an impressive number of exchange traded funds (ETFs) and exchange traded notes (ETNs) have become available, increasing the number of trading opportunities for investors. One of the more popular ones for trading volatility has been the VXX, the iPath S&P 500 VIX Short-Term Futures ETN. The purpose of the VXX is to allow traders to hedge portfolios against loss due to sudden changes in market volatility, or to directly profit from speculating in changes in market volatility. Although many traders use the VXX to trade volatility, there are some important differences between the VIX and the VXX that a trader must understand. The VXX is designed to track VIX futures and provides the trader with exposure to the first and second month VIX futures contracts.
This has the effect of smoothing out the moves in the VIX, and captures only about half of the daily move in the VIX. The VXX tracks what the market anticipates future volatility will be, and
therefore generally exhibits less volatility than the spot VIX.
Both the VIX and the VXX have been in a recent downtrend. The preceding chart shows the downtrend in VXX over the past two quarters, and traders have profiting during this period by shorting VXX or buying VXX puts.
It is clear that traders have been expecting lower volatility, and therefore smaller price movements. One would think that this would have a negative effect on day trading, since day trading relies on price movement. In the previous issue of the NetPicks Informer, I presented a tool that I use to help in the selection of time frames. It looks at price trading ranges for various markets and can be used to locate times of the day where price moves the most. It plots the average range that price moves in each half-hour period of the day over a selected period of time. The tool can also be used to look at trading range trends over time and compare two different calendar periods. In this issue, I will examine a number of markets, and compare the daily half-hour trading ranges of the fourth quarter of 2010 with the first quarter that just completed in 2011, beginning with ES, the emini S&P 500 futures contract shown below.
One would have expected that with the lower volatility expressed by the VIX, and lower future volatility expressed by the VXX that there would be smaller average price movements across the trading day, but this was not the case. In fact, during the first quarter of 2011, the ES showed about a half a point increase in trading range during the market hours that we would most likely be trading.
Another popular index futures contract, the NQ (NASDAQ 100 futures), also showed increased trading range during the first quarter. It was up by 1-1/2 points, or about 25% during the opening hours that we tend to trade.

The other stock indexes such as the DOW emini and Russell 2000 emini also showed increased trading ranges during the first quarter. Even though volatility was down, there were great day trading opportunities with the stock indexes.
Since crude oil has been in the news a lot lately, let’s take a look at how crude oil futures trading ranges have changed. Below is a chart comparing the average trading ranges of CL between Q4 2010 and Q1 2011.
With what has been happening to crude oil prices lately, we would expect to see an increase in average trading range during the morning hours that we trade, and this is exactly what we see. In fact, the average range has increased by about 40%. Also, it is interesting to note that the period between 1800 and 1900 has seen activity lately that approaches the activity that we normally saw during the morning hours of the previous quarter. Other commodities futures also showed increase in price movement during this quarter.
What can we conclude from these examples? First, when it comes to looking at volatility, we cannot assume that if market volatility is low that we will not see good day trading ranges on our stock
index futures. Remember that the VIX and the VXX provide a measure of expected or implied volatility: the VIX is a measure of expected price movement of the general stock market over the next 30 days, and the VXX is a measure of future volatility of the VIX. They do not tell us what the actual price movements will be, and certainly not at the daily level. Another conclusion that we can draw is that it is valuable to have some idea how these market trading ranges change over time. This information can help us determine what times frames we want to trade, and what parameters we may want to adjust in our system and back test before we make potential changes to our trade plan.
If you are interested in the Excel spreadsheet that was used to calculate these trading ranges, feel free to contact me at bob@netpicks.com.


