VIX Index
Post on: 21 Июнь, 2015 No Comment

Comments ( )
Investors are motivated by two things and two things only: fear and greed.
It’s just that simple.
That said, more often than not, they turn quite bullish when they think a stock is headed higher and quite bearish when they fear that all is lost.
The trouble with this strategy is that, for most retail investors, it is precisely at these extremes in sentiment when they often lose their shirts.
Because while conventional financial theory suggests the markets behave rationally, not accounting for the emotional aspect of the trade often leads to all of the wrong entry and exit points.
And believe me when I tell you this: It’s hard to turn a buck on the Street when you’re constantly getting either one or both of them wrong.
That’s why successful technical analysts often rely on the VIX Index to assess whether or not the current market sentiment is either excessively bullish or bearish in order to plot their next move.
Make Better Trades Using the Fear Gauge
You see, the VIX Index is one of the so-called contrarian indicators. That is, it tells you whether or not the markets have reached an extreme position one way or the other. If so, this tends to be a sure sign that the markets are about to stage a reversal.
The idea here is that if the wide majority believes one bet is such a sure thing, they pile on. But by the time that happens, the market is usually ready to turn the other way.
Of course, the crowd hardly ever gets it right (so much for the rational market theory).
So the smart money simply uses the VIX Indicator as a sign to bet against them all.
If the crowd is feeling very bullish, in other words, it is definitely time to think about getting bearish.
It’s counter-intuitive for sure, but it works 99% of the time especially in volatile markets.
And that’s why the VIX indicator is a trader’s best friend these days. because if there is one way to describe today’s markets, it would have to ‘volatile.’
So, what is the VIX Index?
Developed by the Chicago Board Options Exchange in 1993, the CBOE Volatility Index (Chicago Options: ^VIX ) is one of the Street’s most widely accepted methods to gauge stock market volatility.
Using short-term near-the-money call and put options, the index measures the implied volatility of S&P 500 Index options over the coming 30-day period.
But because it is basically a derivative of a derivative, it acts more like a market thermometer more than anything else. And like a thermometer, there are specific numbers that tell the market’s story.
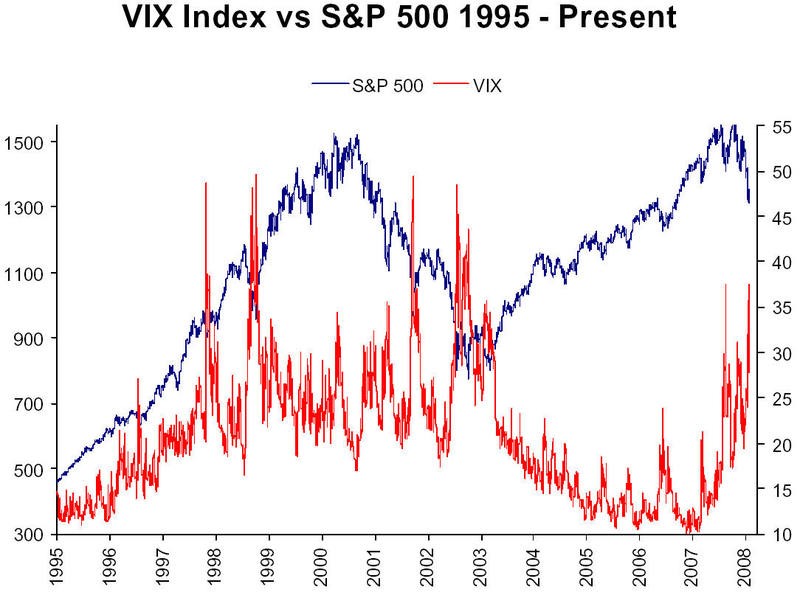
A level below 20 is generally considered to be bearish, indicating that investors have become overly complacent.
Meanwhile, with a reading of greater than 30, a high level of investor fear is implied, which is bullish from a contrarian point of view.
The smart thing to do then is to wait for peaks in the VIX above 30 and let the VIX start to decline before placing your buy.
As the volatility declines, stocks in general will rise and you can make big profits.
You see it time and time again. In fact, the old saying with the VIX is: When the VIX is high, it’s time to buy.
That’s because when volatility is high and rising, the crowd is fearful. And when the crowd is fearful, they sell and stock prices fall dramatically, leaving bargains for moneymaking traders.
Related Articles on VIX Index
The upshot is the charts suggest that within the next 957 points, we will see a correction. The Dow has about 7.4% upside here, with a good chance of a 10% to 15% correction back to 11,000 and change within the next 3 months.
Analyst Ian Cooper takes a look at the history of the fear gauge and identifies the safest ways to trade it
Wealth Daily Editor Ian Cooper wraps up the week with a look at coming volatility, and offers a simple way to profit from a well-known no-options options trade


