Using Options to Trade Double Tops
Post on: 16 Март, 2015 No Comment

Potential double top formations can provide profit opportunities for option traders and MoneyShow’s Tom Aspray explains how two key technical tools can be used to take advantage of this Important pattern.
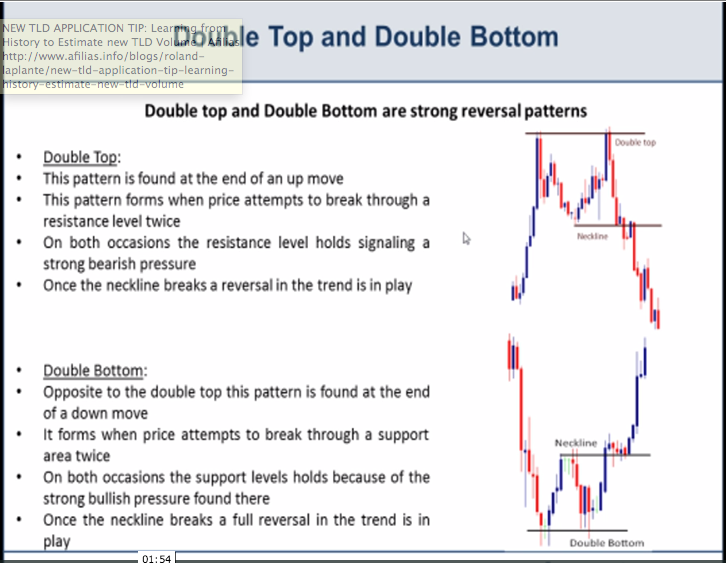
Double tops and double bottoms can often alert the investor to major turning points especially when they are observed in the weekly charts of a major market average or a key commodity like crude oil.
Last November I discussed double bottom formations on crude oil (see chart ) and many stocks were also showing potential double bottom formations.
There are many articles on the classic characteristics of double top formations and the 1948 technical analysis classic Technical Analysis of Stock Trends from Robert D. Edwards and John Magee is still a wonderful source on the topic.
The traditional interpretation dictates that the formation must be completed before action is taken. In the crude oil example it took a close above $90.52, which was almost 20% above the double bottom lows, to confirm the bottom and project a move to $105.33.
To confirm a double top formation prices often need to decline significantly from their highs and stops above the previous peak can make the risk uncomfortably high. Often times what appears to be a double top or bottom on the daily chart turns out to just be part of a continuation pattern. Traders who wait for the formation to be confirmed often have trouble managing their risk and therefore do not take the trade.
In this article, I will show you how combining the chart formation with two technical tools can allow you to take advantage of these situations using options. With this approach you can find a low risk entry point if a true double top is being formed, but also can profit if it is just part of a continuation pattern.
Click to Enlarge
This weekly chart of Kimberly-Clark Corp. (KMB ) shows what appears to be the formation of a double top. The initial high in August at $88.25 (point 1) was followed by a drop to $81.25 the following week. Prices stabilized for five weeks as support was found in the $82 area, line a.
KMB rallied back to $87.80 in October (point 2) before dropping sharply last week. Of course the key support at $81.29-$82 needs to be broken in order to complete the double top.
In order to determine the downside target you take the difference between the high and support ($88.25-$81.29 or $6.96) and subtract it from $81.29 to get a downside target of $74.33.
I have found two technical tools to be quite useful in identifying double tops. The first is what I call the RSI3, which I learned about from cycle expert Walt Bressert. It is calculated by taking a three period simple moving average of a five period RSI. As discussed in a past trading lesson. I use the RSI3 along with its 13 period WMA not only to identify divergences but also to identify changes in momentum.
For KMB, the weekly RSI3 peaked in May and formed a lower high, line b, as KMB was making its high in August (point 1). The RSI made even a lower high in October and was already declining at point 2. The RSI3 has subsequently dropped below its WMA.
I find the on-balance-volume or OBV to be quite good in identifying changes in the volume patterns that are essential in identifying double top or bottom formations.

Volume in KMB was heavy on the decline from the August high and while there were no weekly divergences, the OBV did break its uptrend, line c. This weakness was confirmed when the OBV failed to move back above its flattening WMA on the October rally. The increase in volume last week is consistent with a double top.
For option trading, I feel you have to look at the daily analysis to get your entry signals. The potential double top formation, points 1 and 2, is quite clear on the daily chart as is the key support at line a.
The RSI3 formed a short-term negative divergence (line b) as KMB closed at $87.68 on October 18. The candle chart shows that KMB closed lower the following day and the RSI3 turned lower as indicated by vertical line 3.
The daily OBV also formed lower highs in October but did not form a negative divergence as KMB did not move above the August high. The OBV did test its resistance at line c and by October 19 had also had turned lower.
In option trading, the strike price and liquidity are key considerations. On October 22, the November 85 put opened at $0.75 and closed at $0.95. The following day it traded in a range of $0.88 to $1.10.
I favor establishing multiple positions in one strike price so that you are able to scale out of your position. Given the October 19 shift in momentum, buying four Nov. 85 puts at $0.90 would have been a reasonable trade.
Of course risk control is a key concern with options as second guessing your stop or exit level is often disastrous. This position should have been closed out if KMB closed above $88.25, which was the August high.


