Use the McClellan Oscillator to Determine Breadth
Post on: 7 Апрель, 2015 No Comment

The McClellan Oscillator is a popular market breadth indicator that can be used for market timing for short term traders. This indicator can give traders a true sense of what is happening under the surface in the stock market.
When the market rallies or sells off, it can be skewed one way or another by large cap stocks in the index which can give a false impression of the true strength (or weakness) in the stock market.
Warning! This page is only for the biggest of stock market geeks!
What is breadth?
Breadth refers to the fraction of stocks that are participating in an up or down move in the market. For example, if a large number of stocks are participating in an up move in the market then we can interpret this as being bullish. If, on the other hand, only a small number of stocks are making an up move in the market, then we can interpret this as being bearish.
The McClellan oscillator
The McClellan Oscillator calculated by subtracting the difference between 39 day exponential moving average and the 19 day exponential moving average of advancing minus declining stocks (smoothing of the Advance/Decline line). It is plotted against the movements of a particular exchange, usually the NYSE, but it is also available for the Nasdaq.
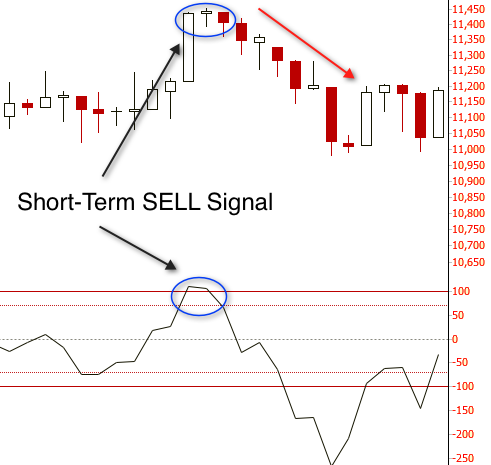
Let’s look at a chart of the NYSE with the McClellan Oscillator above it.
There are several ways to use this indicator depending on what type of trader you are, but generally when this indicator is positive, it means that money is flowing into the market. When the indicator is negative, it means that money is flowing out of the market.
Here is how you can you can incorporate this market breadth indicator into your trading style.
Swing Traders can use the McClellan Oscillator to identify overbought/oversold levels. Buy signals are generated when the indicator gets into the -50 to -100 range and then turns up. Sell signals are generated when the indicator gets into the +50 to +100 range and then turns down. If the oscillator gets into the -100 or +100 range, then this would be considered an extreme condition and reversals can be anticipated.
Momentum traders
Momentum traders can use the McClellan Oscillator to participate in market rallies and market declines. A buy signal is given when the oscillator crosses above 0. A sell signal is given when the oscillator crosses below 0.
Investors
Investors can use the McClellan Oscillator to judge the health of the market by peak and trough analysis. In the chart above you can see how even though the market was showing rising peaks and troughs, the McClellan Oscillator was showing declining peaks and troughs — a bearish divergence.
McClellan Summation Index
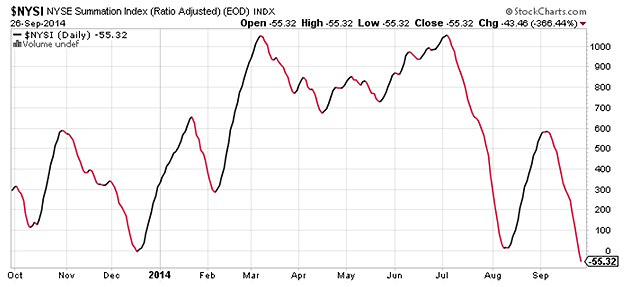
Now what would happen if you added up all of the values of the McClellan Oscillator? You would come up with what is known as the Summation Index. This is a longer term view of the market that stock traders and investors use to identify the beginning and ends of bull markets — the major trends in the market.

Here is a weekly chart of the NYSE Composite Index with the McClellan Summation Index above it.
There are a couple of interesting things on this chart. First notice how on the left side of the chart, the market was technically in a downtrend but the McClellan Summation Index was showing rising peaks and troughs — a bullish divergence.
Also, notice how major corrections in the market happen when the index is below 0 and when the index is above 0 the market generally does pretty well.
Conclusion
For short term market timing and breadth analysis, use the McClellan Oscillator. For a longer term analysis of the health of the stock market, use the McClellan Summation Index.
You are identifying 3 factors:
- divergences
- overbought/oversold levels
- zero line crossovers
So when the media is screaming about how great the market is, take a look at these indicators to see what is really going on. Also, when every media outlet is crying over how bad the market is doing, pull up a chart and see for yourself if it really is worth crying over.
Usually, these folks are so wrong!


