Use Sector Analysis to Find Winning Stocks
Post on: 16 Март, 2015 No Comment

Industry Sector Analysis Will Improve Your Results
Stocks like sheep, move in herds. If you want your sheep to move north,
you better pick a sheep in a herd moving north. John Bollinger
An industry group or sector consists of companies in closely related businesses such as disk drive manufacturers, airlines, woman’s clothing stores, etc. Stocks within a sector tend to move together because companies within the same industry group are affected in similar ways by market and economic conditions.
Mutual fund and other institutional managers track industry groups closely to determine which sectors are cooling down, and which ones are coming into favor. Once a sector trend is identified, the group rotates into favor as one institution after another begins accumulating shares in the best companies in the group. As more money flows into the group, the best companies become fully valued and money moves into secondary stocks in the sector. Eventually the group becomes overpriced, or economic conditions for the group turn unfavorable, and money rotates into the next hot sector.
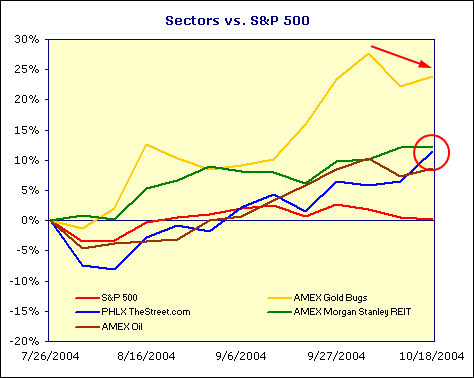
In recent months, we’ve seen surges in the prices of oil companies, gold mining stocks, retail stores, and financial services companies, among others. When those industries took off, most stocks in the groups went along.
No matter what the overall market is doing, you’ll always find some industry groups moving up, and others heading down. A popular investment strategy is to pick the strongest stock in a strong industry.
Here are Web sites with free tools to help you implement this strategy.
Wall Street City
Telescan’s Wall Street City (www.wallstreetcity.com ) sports an impressive set of industry group analysis tools. Telescan, Inc. based in Houston, Texas is a publicly traded corporation that has been supplying stock market data and analysis tools for several years.
From their home page, select Industry Group Center on the Investment Centers menu on the left to display the Industry Group menu and a tutorial explaining Wall Street City’s approach to industry group analysis.
Select Best & Worst Industries from the menu to see the entire list of industry groups sorted with the best performing group on top, based on one-day’s returns. Unless you’re a short-term trader, one day doesn’t mean much, but you can select other periods ranging from one-week to five years by clicking on the corresponding links. I picked six weeks.
Topping the list was Retail/stores/mail order-catalogs showing a healthy 28.9 percent return. On the other hand, Tobacco/cigarettes showed the worst return—the group was down 31.3 percent in six weeks.
Click on the industry name to see the stocks making up the group, sorted with the best performers at the top of the list The best company in the retail/stores/mail-order catalogs group was Right Start with a 75.3 percent return. Blair Corporation was at the bottom, losing 21.8 percent in six weeks.
You can research Right Start, or any company in the group by clicking on the company name. That displays a price chart for the stock and a dropdown menu (Select Company Report) listing a variety of available reports and news sources for the company. Of the 17 reports listed on the menu, four (Company Profile, Macro World Price Forecast, ProSearch Criteria, and S&P Company Report) require a subscription, the rest are free. Some are exclusive to Wall Street City including two of my favorites: Quick Facts and Telescan Rankings.
You’ll need patience when using Wall Street City, some of the screens take a long time to display.
Money Central
Microsoft’s Money Central (moneycentral.msn.com ) has an easy to use feature that highlights the 10 best and worst performing industries over the past month. Select Investor from the dropdown menu on their homepage, then click Top 10 Lists under Markets on the left, and finally select Industries. Microsoft shows you the best and worst performing industry groups including the percentage change of each group during the past month. The results are updated nightly.
When I checked last Wednesday, health care plans was the best performer with a 24.5 percent gain, and cigarettes was the worst, falling 27.9 percent during the past month. Clicking on the industry name displays a list of the 10 best and 10 worst performing stocks in the group, also based on one-month’s performance.
I selected health care plans and found that LifePoint Hospitals, a recent spin-off of Columbia/HCA, was the leader—it soared 52.9 percent in one month. Clicking LifePoint’s ticker symbol displays a current quote, and a menu accessing all of the research information available on the site for the company.
Briefing.com
Briefing.com (www.briefing.com ) takes a different approach to industry analysis. Instead of relying on recent performance, Briefing.com employs real people to analyze the future prospects of each industry.
Briefing.com charges $6.95 per month to see the ratings on their site, but E*Trade gives it to you free. You have to register, but you don’t have to be an E*Trade customer to see the reports.
Briefing.com refers to industry groups as sectors. From E*Trade’s home page, select Markets on the top menu, and then Sector Ratings under Analysis & Commentary near the bottom of the menu on the left.
Briefing.com covers 26 industries, from aerospace/defense to tobacco. The ratings are summarized in a chart at the top. The ratings range from one (outperform) to five (underperform), with one being the best. Some sectors have both short-term and long-term ratings, e.g. 3/2, in this case meaning the short-term rating is three (market performer), and the long-term rating is two (slightly outperform).
Briefing.com provides a detailed analysis of each industry. When I checked, the only top rated industries were the Internet and Telecom Equipment sectors.
In their analysis of the Internet group, they pointed to the still under supplied business-to-business segment, holiday and pre Y2K buying in the commerce/portal groups, and many investors want in – no matter what the price, as reasons for their high expectations. Briefing.com mentioned rapid growth opportunities among the reasons for favoring the telecom equipment group.

Tobacco was the only industry warranting a five rating (underperform). Here, Briefing.com minced no words, saying they expect Philip Morris to end up declaring bankruptcy, and they expect others in the field to face a similar threat.
Briefing.com lists all of the major companies in each group, but they only occasionally mention their favorites, and then only in passing. For instance, they named 17 companies in the top-rated telecommunications equipment sector without differentiating between the investment quality of any of them.
The ratings look like they are updated every two or three months. When I looked, eight sectors hadn’t been updated since August.
Equity Trader
You can access John Bollinger’s Group Power ratings at www.equitytrader.com. Bollinger is a well-respected practitioner of the technical analysis approach to stock selection. In fact, he invented an indicator used by many market technicians called Bollinger Bands. He developed an analysis technique called Group Power to forecast whether a particular group is likely to over or under-perform the market as a whole in the near future.
Clicking on Groups takes you to the Group Power Industry Group Structure page. There you’ll see a list of 13 major industry groups such as Utilities, Technology, Financial, etc. Each industry group has an accompanying set of six red, yellow, or green signals—they look like traffic lights. Two green lights on the right, two red lights on the left, and two yellow lights in the middle. Interpretation is intuitive. If both green lights are on—Bollinger is very positive on the sector, and red lights mean stay away. When I looked, all the sectors had one or two yellow lights on. There were no red or green lights.
Clicking on a major group brings up a list of sub-sectors. For instance, I clicked on Technology and up came 14 sub-sectors such as computers, software, networking, etc. The sub-sectors have the same color signals: red, green and yellow lights. Again, only yellow showed. Clicking on Computers PC brought up a list of six computer manufacturers: Apple Computer, Micron Electronics, Gateway 2000, Dell, Compaq Computer, and Intevac. Apple Computer showed a single green light (weak buy), and the others all showed yellow. Bollinger selects stocks for each sub-sector based not only on the company’s line of business, but also on its stock-trading pattern. Stocks in the same group have to have similar trading patterns, as well as be in the same business.
Smart Money
Smart Money magazine (www.smartmoney.com ) presents the most visually compelling display of industry sector performance I’ve seen anywhere. Even if you’re not interested in sectors, you ought to take a look just to see what can be done on a Web site.
Scroll down to the bottom of the page and click Sector Tracker to bring up a bar chart showing the five best and five worst sectors based on price action for the last day. One day’s action doesn’t tell you much, but you can change the time period to the last five days, the last month, year to date, or the last 52 weeks. The display changes instantaneously when you select each time period.
If you don’t want to look at the best or worst five sectors, you can select other categories including Smart Money Sectors, Basic Materials, Capital Goods, Communications, Consumer Staples, Consumer Cyclicals, or Energy. Clicking on one of these major sectors brings up sub-sectors with bar charts showing the sub-sector performance over the selected time period.
Clicking on a sub-sector brings up a list of companies making up the sub-sector with current stock price and stock performance over the selected time period. If you’re interested in one of the stocks, click on the name to access detailed information on the company.
Industry group price trends tend to last for extended periods, typically several months, if not years. For instance the banking group was in an uptrend from January ’97 until early this year. The wine and liquor segment of the beverage industry is currently experiencing a steep uptrend that started around the middle of last year. Gold mining stocks were in a downtrend that started in the middle of ’96 and lasted until September of this year.
published 11/7/99


