Use pricetoearnings as a guide not a rule The Globe and Mail
Post on: 1 Май, 2015 No Comment

Is there a good time to buy or sell a stock based on the price-to-earnings ratio? Is it time to buy when the P/E is below 10 and to sell when the P/E is high? -B.D.
Unfortunately, it’s not that simple.
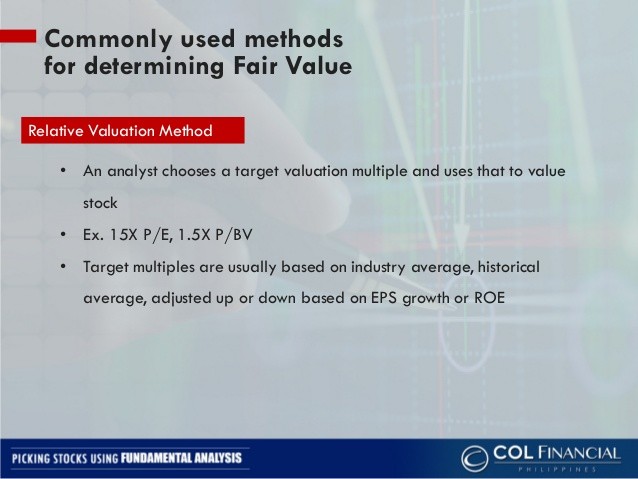
Typically, the P/E ratio refers to the price of the stock divided by the earnings per share over the previous 12 months (the trailing P/E), but it can also refer to price divided by the projected earnings over the next 12 months (the forward P/E). Either way, the P/E indicates how much investors are willing to pay for $1 of earnings.
When a P/E is especially high, it indicates that investors expect the company’s earnings to grow quickly. The danger with high P/E stocks is that if growth falls short of the market’s lofty expectations, the stock can get crushed.
For example, back in 2007, Research in Motion traded at close to $120 and its P/E was an eye-popping 90 times trailing earnings. Now, amid growing worries about RIM’s growth prospects, the stock has plunged to $45.92 and the P/E is a humble 7.4.
High P/E stocks don’t always disappoint. Apple sported a P/E of about 50 in 2007, but the stock has soared about 65 per cent since then. Because Apple’s earnings have grown even faster than the stock price, the P/E has fallen to 18.5. Yoga wear retailer Lululemon Athletica is another example of a high P/E stock that has continued rising.
What about low P/E ratios? Again, it depends. In some cases, when a stock is punished excessively by the market, a low P/E signals a buying opportunity. Anybody who bought Canadian banks during the depths of the financial crisis, when the stocks were selling at single-digit P/Es, was rewarded with huge gains.
But a low P/E can also signal trouble. Yellow Media Inc. for instance, has traded at a P/E of less than 10 since late 2008 (the forward P/E is currently less than 7). But despite its seemingly attractive valuation, the stock has been hitting new lows amid growing doubts about the company’s ability to make the successful transition from print to digital media.
Another thing to keep in mind is that P/Es vary between industries. As such, P/Es are most useful when comparing two companies in the same sector. P/Es also rise and fall with earnings cycles. A mining company may have a very low P/E that makes the stock look cheap, but a depressed valuation may signal that earnings are about to fall.
A variation of the P/E is the PEG – or price-to-earnings growth – ratio. To calculate the PEG, divide the P/E ratio by the company’s projected earnings growth rate over a certain period, usually one to five years.
The PEG ratio was popularized by legendary U.S. fund manager Peter Lynch, who said in his book One Up on Wall Street that “the P/E ratio of any company that’s fairly priced will equal its growth rate.” In other words, investors should look for companies with a PEG of one or less. (You can find a stock’s PEG, P/E and forward P/E ratio on globeinvestor.com).
As an example, a company with a P/E of 20 and a projected earnings growth rate of 25 per cent over the next several years would have a PEG ratio of 20/25, or 0.8. The PEG ratio, of course, is only as good as the earnings projection. Analysts are notoriously bad at predicting where earnings are heading in one year, let alone three or five years.
Here’s my rule of thumb: Be wary of stocks with especially high, or low, price-to-earnings multiples. Use the P/E as a starting point for further research, not as a buy or sell signal by itself.

****
I purchased some CCL.A shares some months ago and there has been no action whatsoever since that time. As a result, I have no idea what the day-to-day value of the shares is. Is there any way for me to find that out? -P.S .
You’re referring to the class A voting shares of CCL Industries Inc. The reason they trade infrequently – compared to CCL’s more liquid non-voting B shares – is that more than 94 per cent of the class A voting shares are held by a private company.
You can still get a general idea of what the class A shares are worth, however.
Call up the stock quote on globeinvestor.com and under the summary tab look at the “bid” and “ask”. (You can also get this information on your discount broker’s website). As I’m writing this, there are 100 shares being bid at $31.75. That means someone is willing to buy 100 shares at that price.
The ask price is $33.30 and there are 200 shares being offered at that price. So that’s what you’d have to pay if you wanted to buy additional shares. Such wide bid and ask spreads are typical of stocks that have a very low public “float”. In the case of CCL.A, there are only about 130,000 shares that trade freely, according to Bloomberg.
This is a big disadvantage, especially if you need to sell your shares in a hurry. That’s why I prefer to stick with large, liquid stocks with lots of buyers and sellers and tight bid-ask spreads.


