Unfair Advantage Trading Software
Post on: 15 Апрель, 2015 No Comment

Unparalleled Market Data
You probably came to CSI for data, which is our specialty. You already know that we provide summary end-of-day market data, but did you know how very broad our offerings are?
CSI’s Offerings.
Quick and Easy Updates
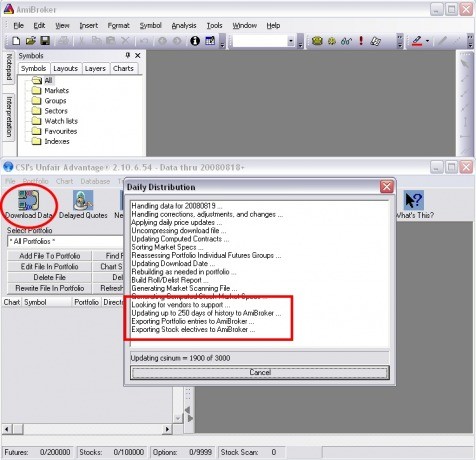
Downloading data is so simple! Just click the telephone icon on the UA toolbar, or update automatically in an unattended mode. You can even visit our website before you download to monitor CSI’s internal posting status of your favorite markets.
Accuracy is Everything!
Data accuracy is assured with Unfair Advantage, and every customer enjoys the same level of perfection. Errors do occur, but any suspicious data point reported by a customer or discovered by our staff will be subject to careful review and verification. If an error is confirmed, a correction will be transmitted the following day. An independent study featured in Futures Magazine found CSI’s error and omission rate lower than all competing data firms tested. (Futures, 9/99 — How Clean is your Data?) We publish monthly all errors committed during the past 30 days.
(Click image to enlarge)
Snapshots Show Market Movement
The UA Snapshot is a great way to get an overview of daily closes, volume and the net change for individual issues. Access by your private portfolio or all futures markets at once.
Revolutionary Compression Saves Disk Space
Unfair Advantage uses a proprietary serial compression (four times more powerful than Microsoft’s Double Space) to hold hundreds of thousands of time series in a relatively small amount of disk space.
More Price Manipulations
Under menu control or at the right-click of your mouse, UA can adjust the presentation of data, such as:
Unfair Advantage
QuickStart Manual
Included with Unfair Advantage is a QuickStart Manual, a guide to using the CSI software. It also serves as a quick an easy reference to UA’s main features. Click here to download the manual online. and get a feel of how UA really operates. (.PDF form, requires Adobe Acrobat to view).
Portfolio Management
Unfair Advantage is designed around one or more user-defined portfolios representing the various futures, stocks, funds, options, etc. you wish to actively follow. The value of a portfolio to the UA user is that all of the items in all portfolios are conveniently grouped and export files are automatically updated at data distribution time. Your specifications for the computed contracts are stored in your portfolios, along with format and reporting frequency (daily, weekly or monthly) requirements for export files. Portfolios are designed to facilitate file appendage whenever possible, but will totally re-create files from scratch whenever necessary. Portfolios make it easy to access charts and studies that may be important to your market interests. Portfolios also make it easy to use UA as the data source for multiple analysis products.
Basic Charting Tools
Every user of Unfair Advantage can see not only today’s summary data reports, but may also review the extensive history of any series in chart form or as a numerical table. Charting with UA is arranged to assist the analyst in comparing one market with another, and lets you simultaneously display studies superimposed over the data. There are many ways in which one might present a chart: The bar frequency of any given time series can range from daily, weekly, monthly or quarterly to annually. Lines may be drawn in selected colors, and the charts may be annotated. Study curves may accompany the pricing data, and can be color-coded as preferred. Use the Study Tools menu or right-click your mouse to reach these features.
Our lineup of standard study tools currently includes:
(Click image to enlarge)
Unbeatable Features
Our decades of experience with international traders and investment firms give us a unique knowledge of the tools that make a difference. Such as:
(Click image to enlarge)
Advanced Chart Tools
UA offers an advanced analysis system that allows users to write and test custom trading systems. This includes an optimization feature with graphic and numerical results. Use VisualBasic or Perl to modify sample programs or write your own trading systems. Sample studies provided in the Advanced Study Library include:


