Understanding the PEG How PEG Is Calculated
Post on: 11 Июнь, 2015 No Comment

Daniel Allan/ Taxi/ Getty Images
In my article on Price to Earnings Ratio or P/E. I noted that this number gave you an idea of what value the market place on a companys earnings.
The P/E is the most popular way to compare the relative value of stocks based on earnings because you calculate it by taking the current price of the stock and divide it by the Earnings Per Share (EPS). This tells you whether a stocks price is high or low relative to its earnings.
Some investors may consider a company with a high P/E overpriced and they may be correct. A high P/E may be a signal that traders have pushed a stocks price beyond the point where any reasonable near term growth is probable.
However, a high P/E may also be a strong vote of confidence that the company still has strong growth prospects in the future, which should mean an even higher stock price.
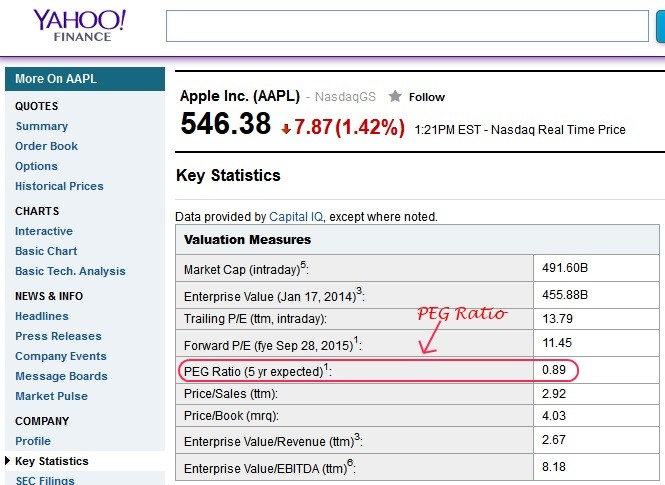
Because the market is usually more concerned about the future than the present, it is always looking for some way to project out. Another ratio you can use will help you look at future earnings growth is called the PEG ratio. The PEG factors in projected earnings growth rates to the P/E for another number to remember.
You calculate the PEG by taking the P/E and dividing it by the projected growth in earnings.
PEG = P/E / (projected growth in earnings)
For example, a stock with a P/E of 30 and projected earning growth next year of 15% would have a PEG of 2 (30 / 15 = 2).
What does the 2 mean? Like all ratios, it simply shows you a relationship. In this case, the lower the number the less you pay for each unit of future earnings growth. So even a stock with a high P/E, but high projected earning growth may be a good value.

Looking at the opposite situation; a low P/E stock with low or no projected earnings growth, you see that what looks like a value may not work out that way. For example, a stock with a P/E of 8 and flat earnings growth equals a PEG of 8. This could prove to be an expensive investment.
A few important things to remember about PEG:
- It is about year-to-year earnings growth
- It relies on projections, which may not always be accurate
The articles in this series:
- Earnings per Share EPS
- Price to Earnings Ratio P/E
- Projected Earning Growth PEG
- Price to Sales P/S
- Price to Book P/B
- Dividend Payout Ratio
- Dividend Yield
- Book Value
- Return on Equity
Back to main article.


